USING CYNEFIN IN PROJECTS
CONTEXTUALIZATION
Cynefin is not a categorization but a sense-making framework. In order to enable sense-making in every unique context the Cynefin framework is created anew. That is called contextualization. In categorization the framework precedes the data. In contextualization the data precedes the framework. As a result, the boundaries between the domains emerge from the data in a social process.
A completed Cynefin framework that is contextualized to the environment and operations of a community, team or organization provides a new shared language with which decision-makers can discuss situations, perspectives and possible actions. It can be used to talk about interpretations of current conditions based on gathered data, to evaluate strategic interventions, and to constructively manage conflict and bring about consensus, without removing conflict [kurtz_new_2003].
Here we will use Cynefin framework to negotiate meaning between Client and Capability contexts when working on a new project [bakardzhiev_adaptable_2016]. The capability is represented by the delivering organization’s knowledge, skills and capacity. The value of the contextualized Cynefin framework is that it provides a unique shared language which reflects the context of the project. This language the Client and the developers can use to discuss perspectives and possible actions.
We will create two contextualized Cynefin frameworks – one for the Client and another for our Capability.
The first thing we need when creating a contextualized Cynefin framework is to write down on hexagon cards the user stories to be delivered. Then we describe the three ontological Cynefin domains. Then the cards are positioned relative to each corner of the overall Cynefin space – without boundaries. Clusters are allowed to form but are not required. This can be done in person or electronically – but must be done socially. Discussion is encouraged while placing the cards. This exercise allows us to stop people from saying: “These are the problems we know about them”. This allows us to say: “These are the problems – frankly we are not yet clear about them”. When we let them decide for themselves what’s in and what’s out of a domain.
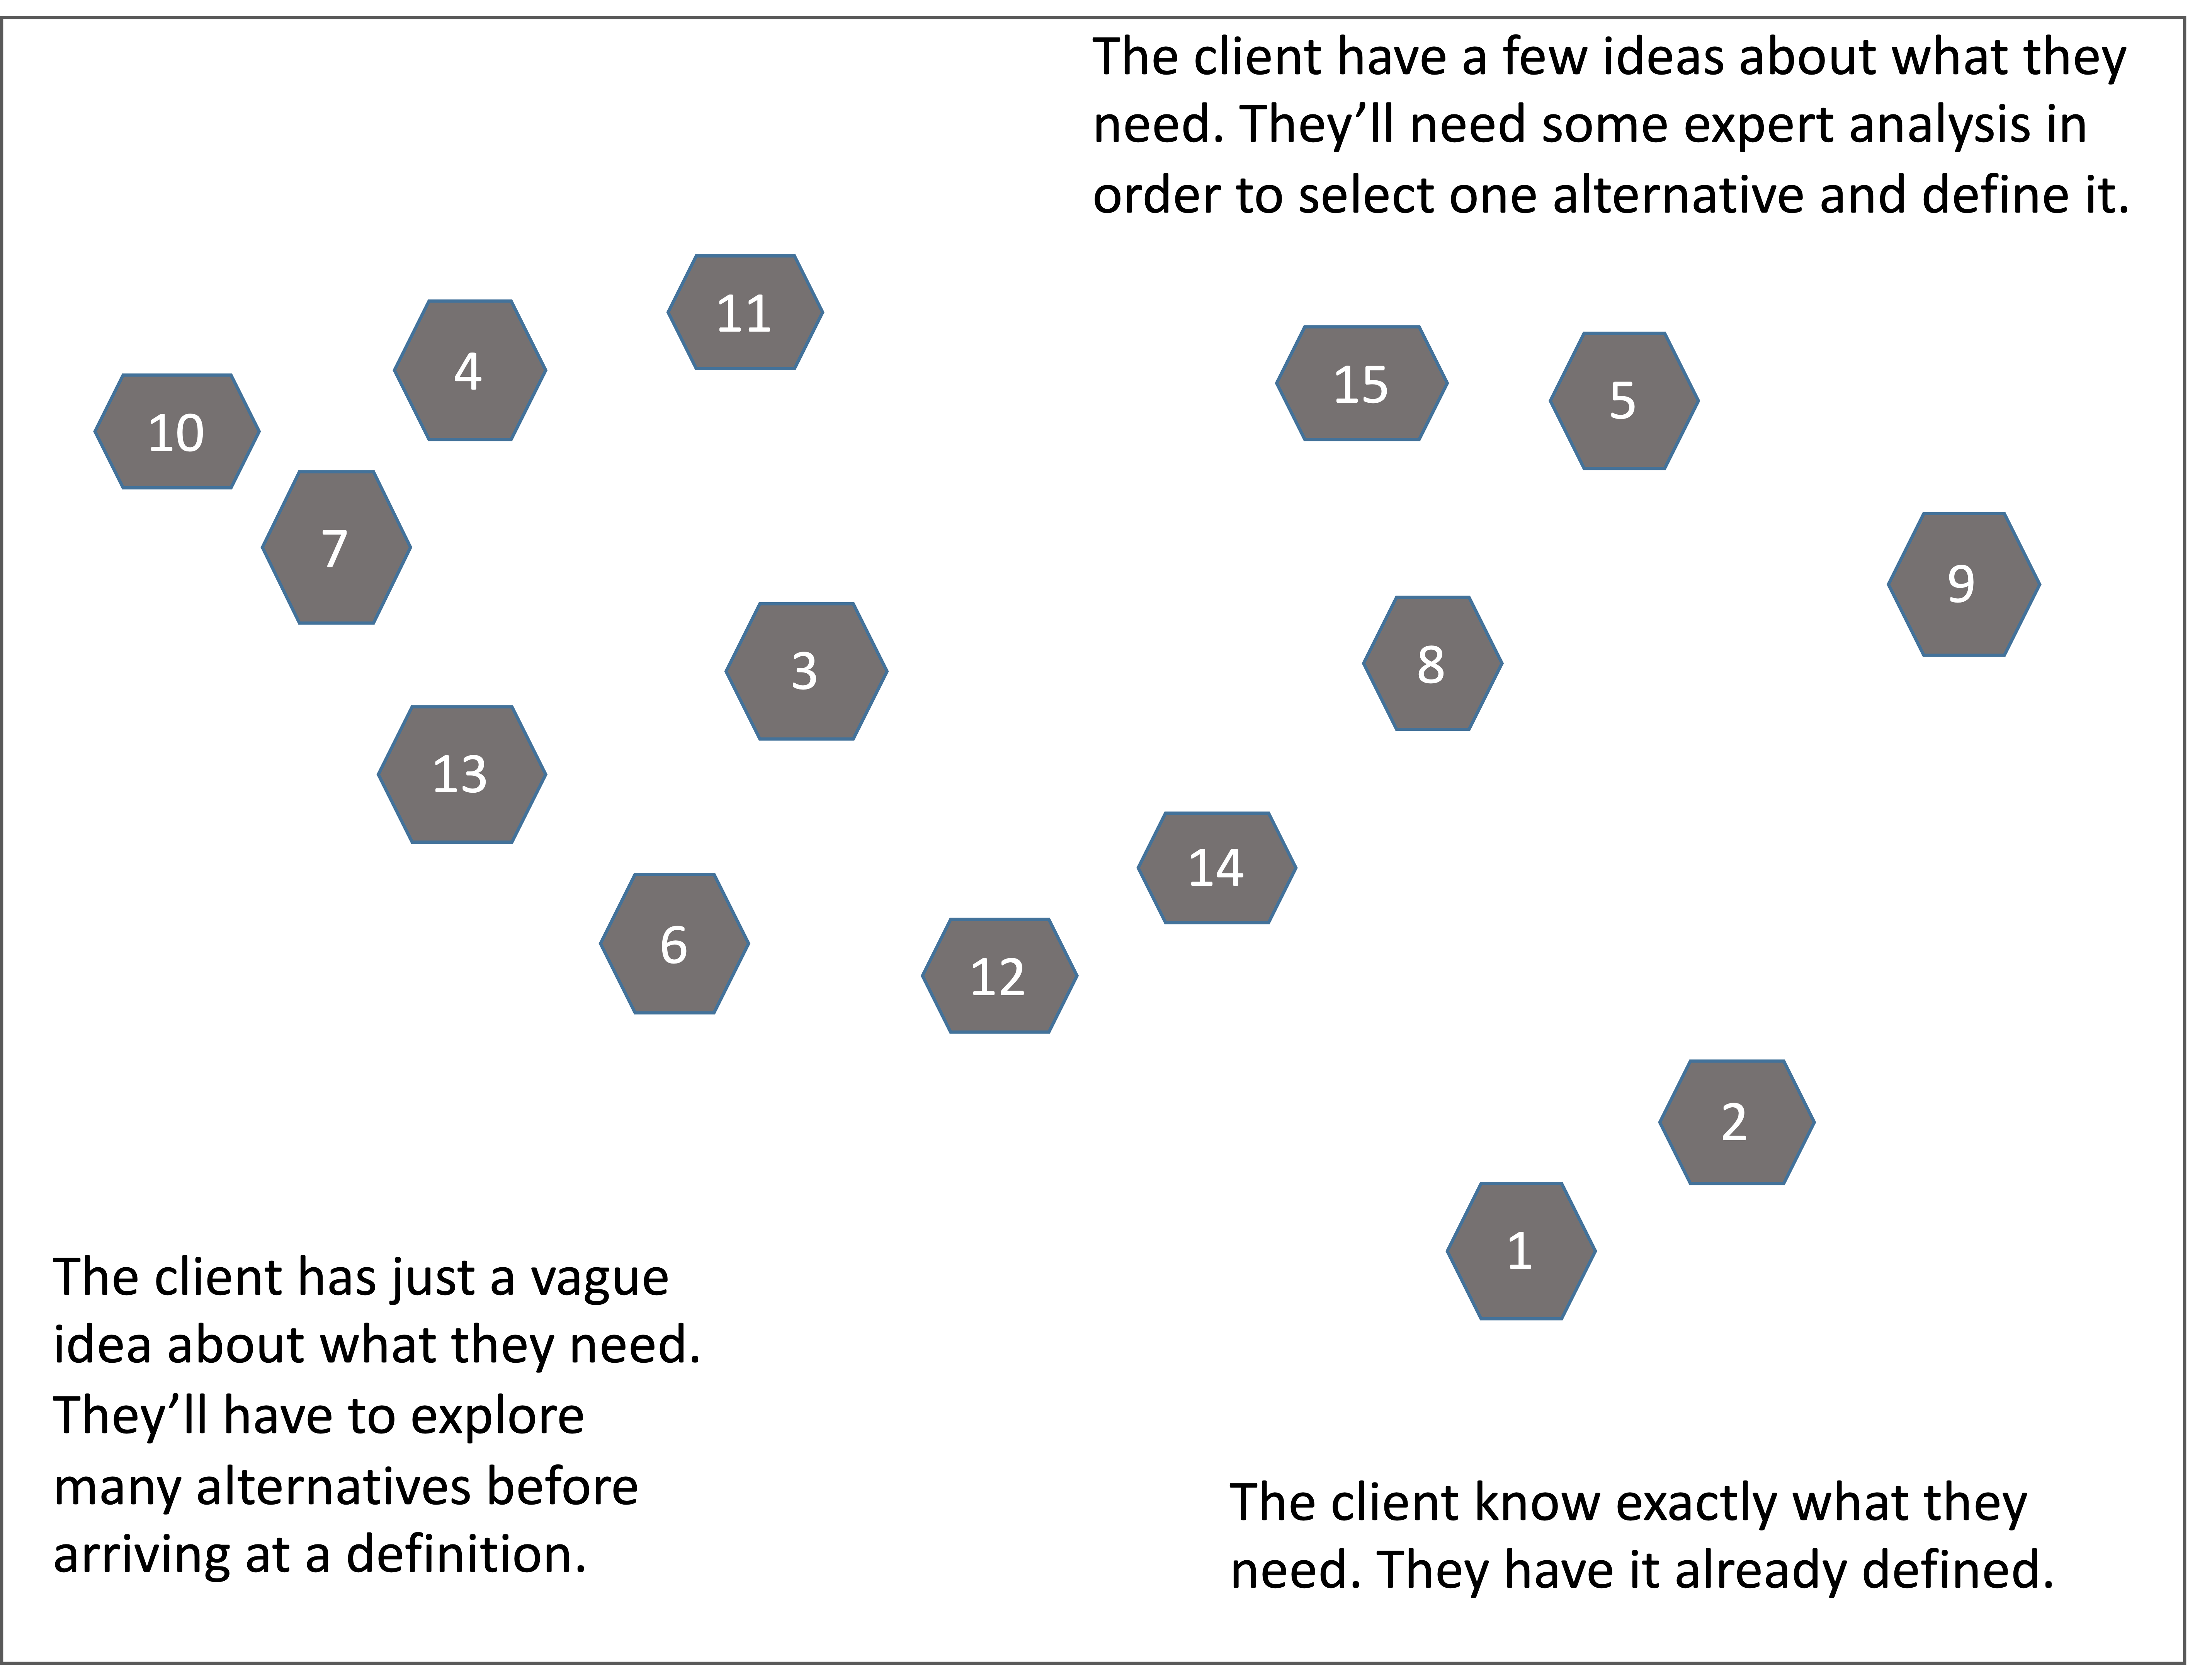
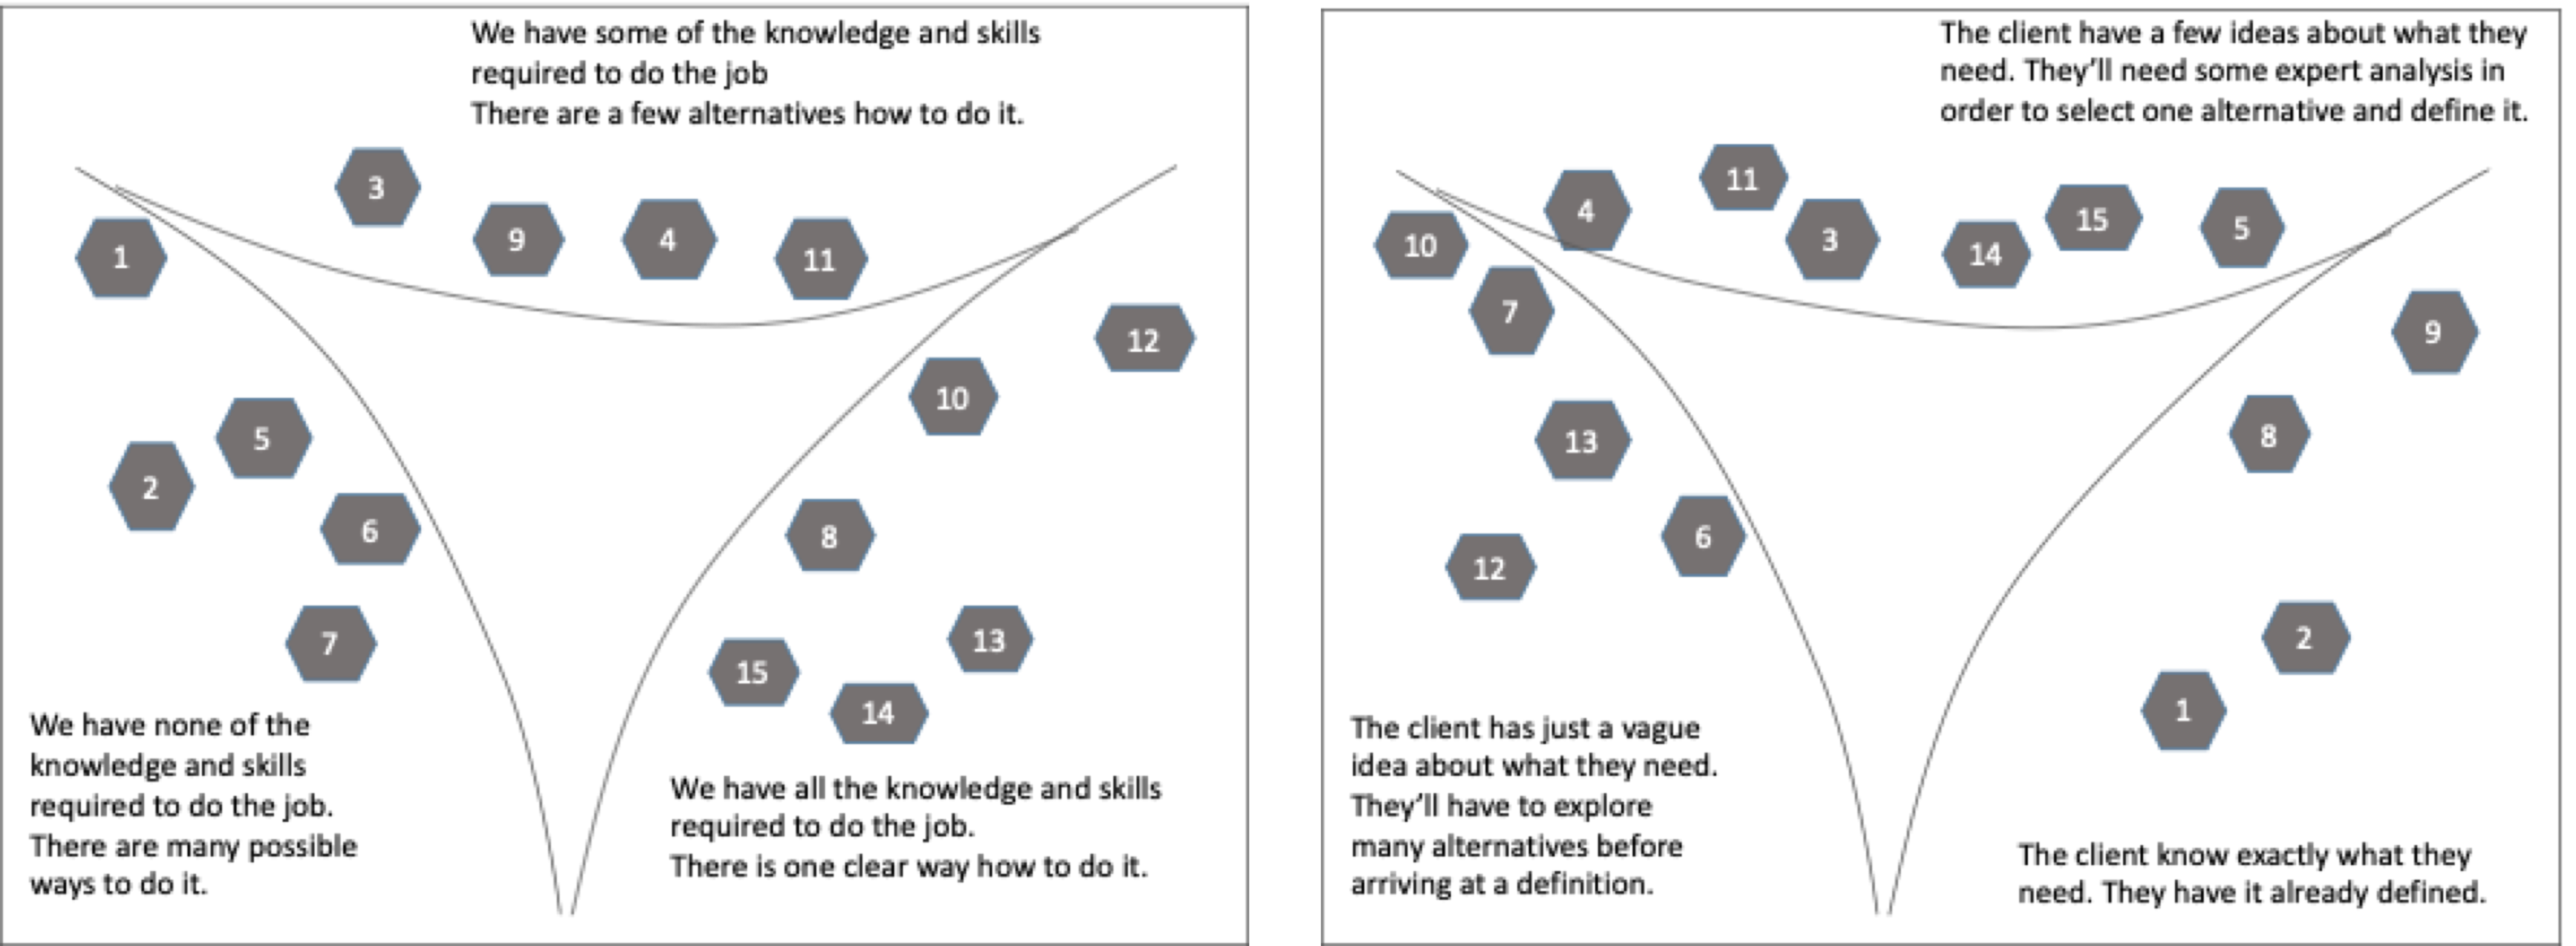
The uncertainty about the nature of the client requirements defines the Cynefin domains for the Client’s context. The labels are about “what” are the options they need to be delivered.
We will use only three cases:
- The client know exactly what they need. They have it already defined. (Clear)
- The client have a few ideas about what they need. They’ll need some expert analysis in order to select one alternative and define it. (Complicated)
- The client has just a vague idea about what they need. They’ll have to explore many alternatives before arriving at a definition. (Complex)
We draw those labels in the corners on a very large flipchart as presented on Figure 4 and talk about the extremes in the context of the overall purpose of the project.
Then we find three cards that fit at the extremes and place one card in each corner. At this point we should have three cards in the three corners of our flipchart. Then we select one of the remaining cards at random and place it as if it has elastic bounds to the three corners. Is it more like this, or that or close to the middle? Again it’s a group discussion.
Next step – take another cards at random. We place it against the three corners but also to the one we just put down. After that keep going with the rest of the cards.
After the initial placement – we never allow to move a card by itself, but only by braking it down into cards and moving the new cards.
Figure 4: Contextualised Cynefin instance : Step 1
Some caution is in order - we never give people an example from their own data of what should be in each of the three corners when we are doing this! As complexity thinking facilitators we realize that people watch what we are doing and assume huge amount of intention. If we want to emphasise we pick an example that has nothing to do with their data.
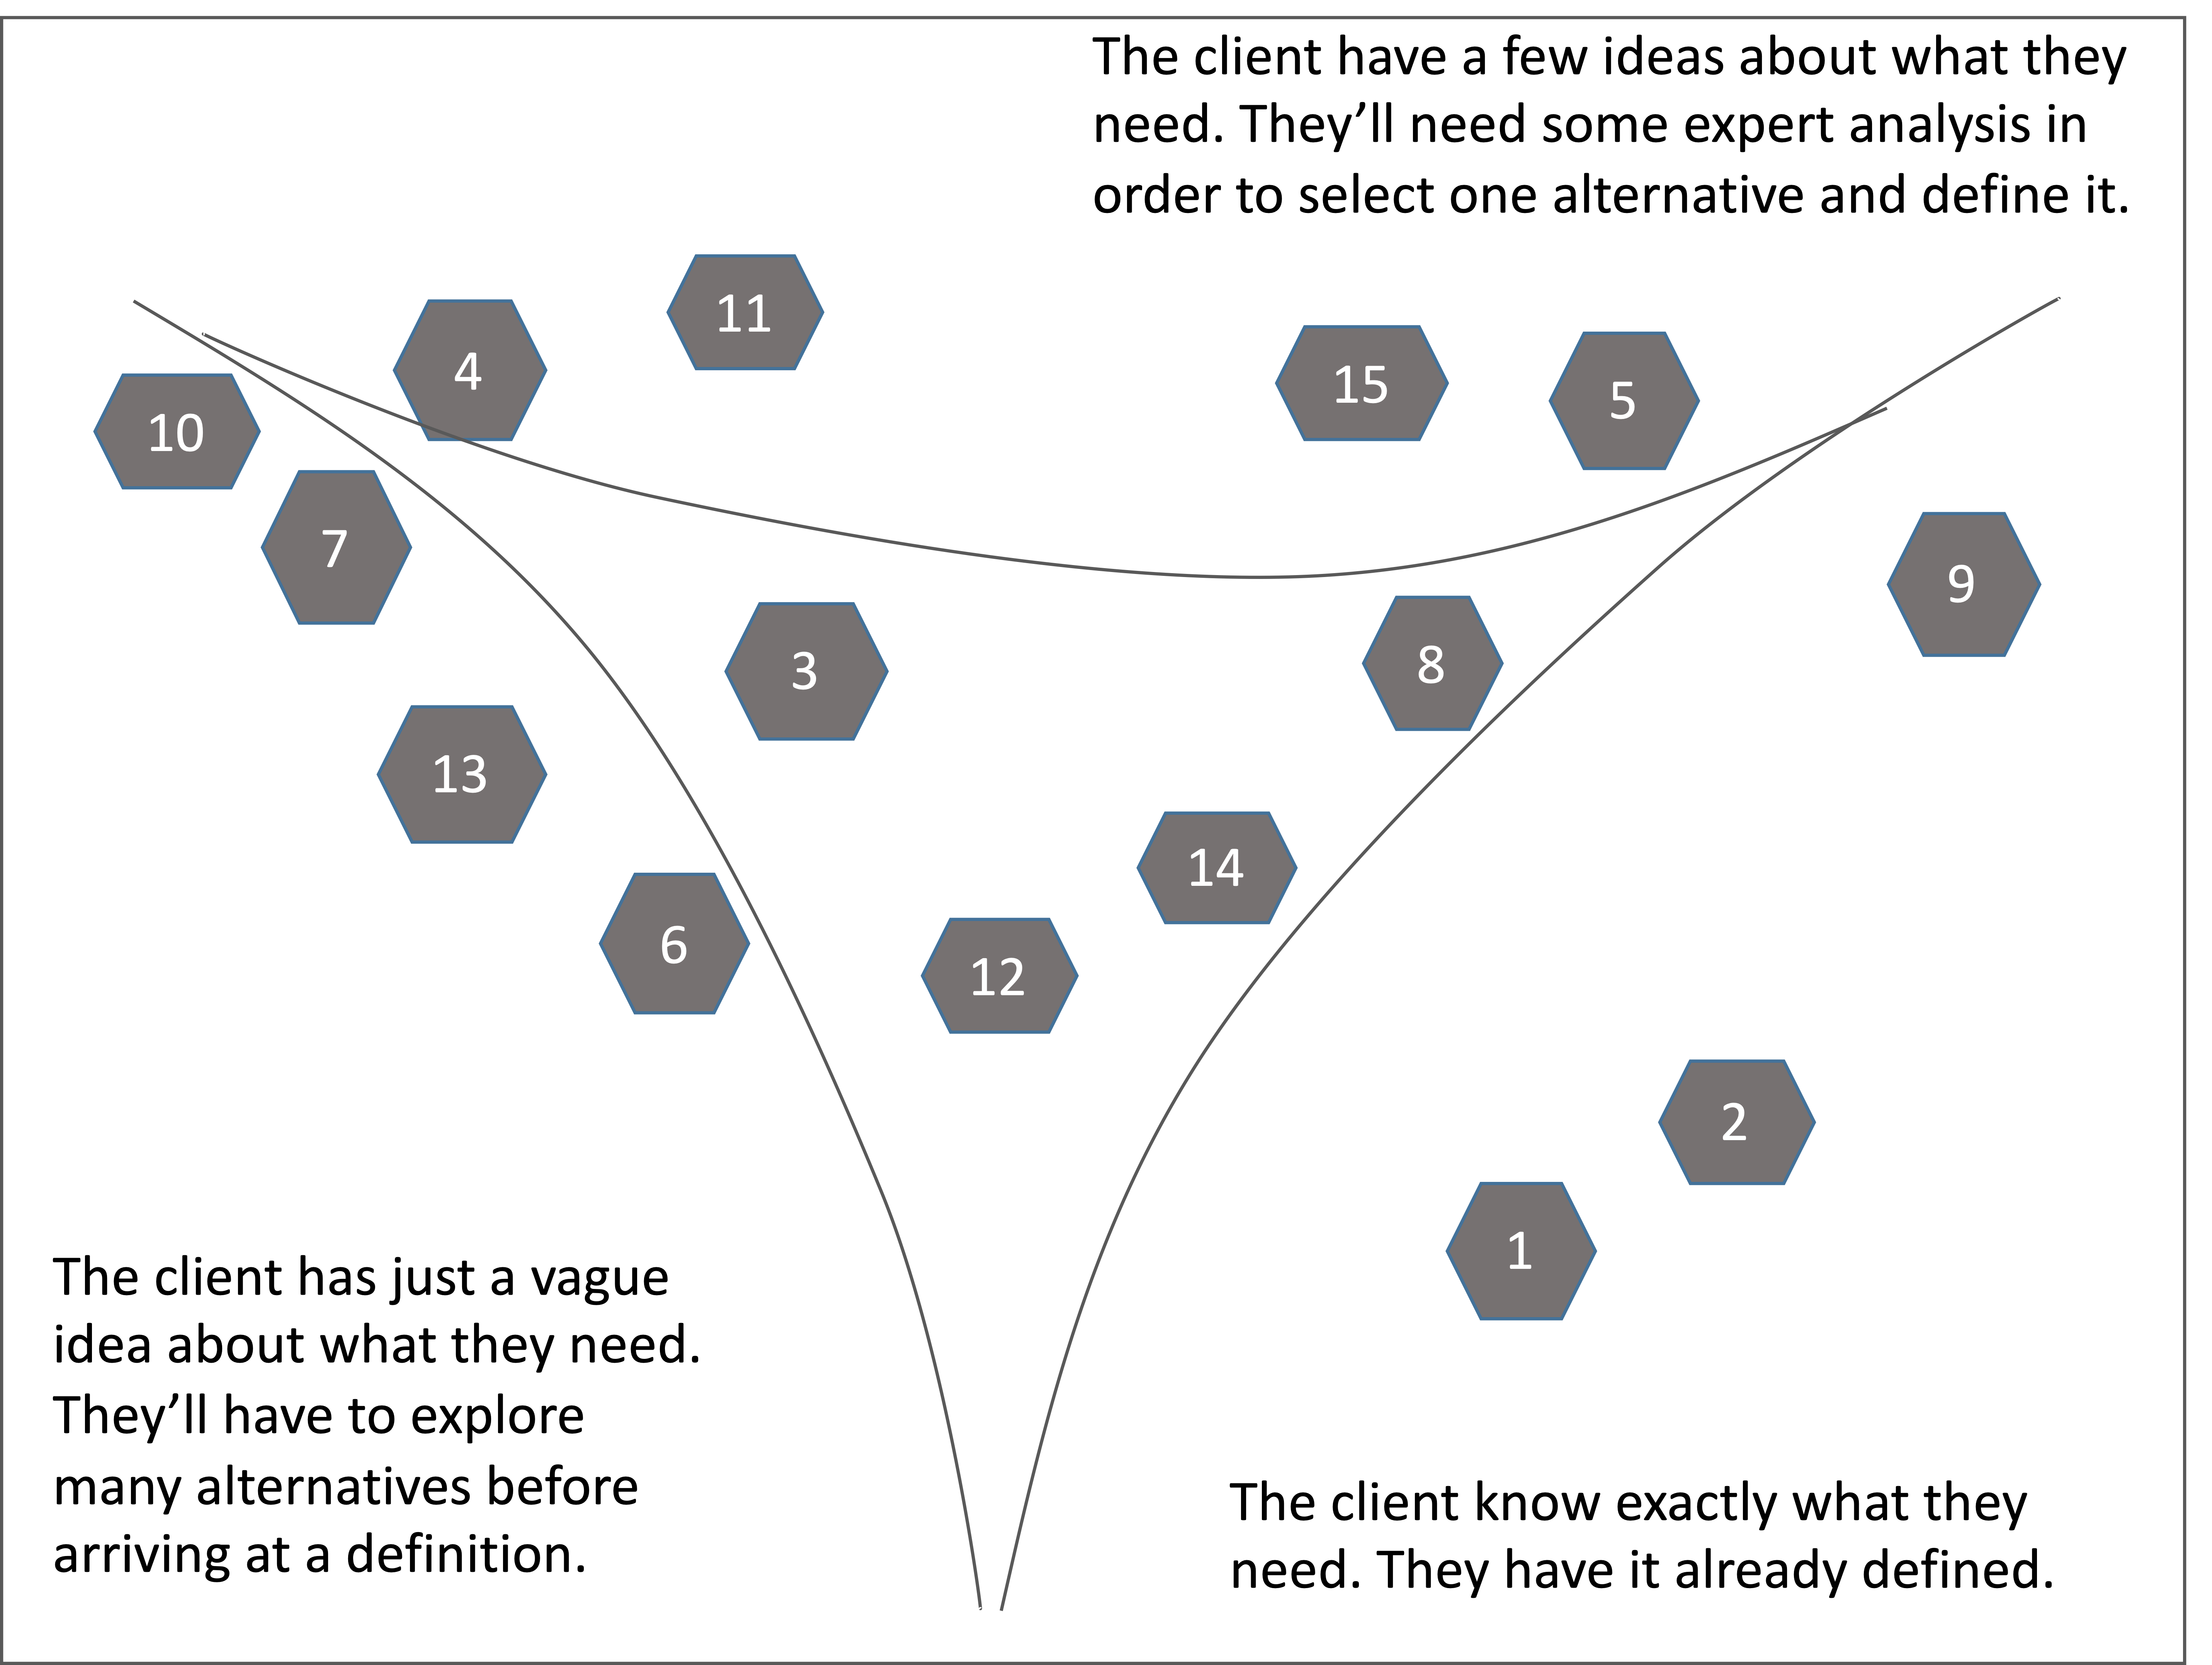
The next step is to define the boundaries as shown on Figure 5. When all options are placed, lines are drawn between the user stories that are clearly in one domain leaving a central area of disorder. Then the lines are “pulled in” to make the distinctions between domains clearer. If a story is in the central area of disorder or it lies on a line it is split into two or more user stories that can be moved to a particular domain. This process involves discussion as consensus must be reached.
By defining the boundaries, we are not pushing people into categorisation! After the contexualization we can move into categorization. We want to have categorization but what we don’t want is to have that pre-defined. If people want to do premature categorization we can remind them that’s not what they should be doing.
Figure 5: Contextualised Cynefin instance : Step 2
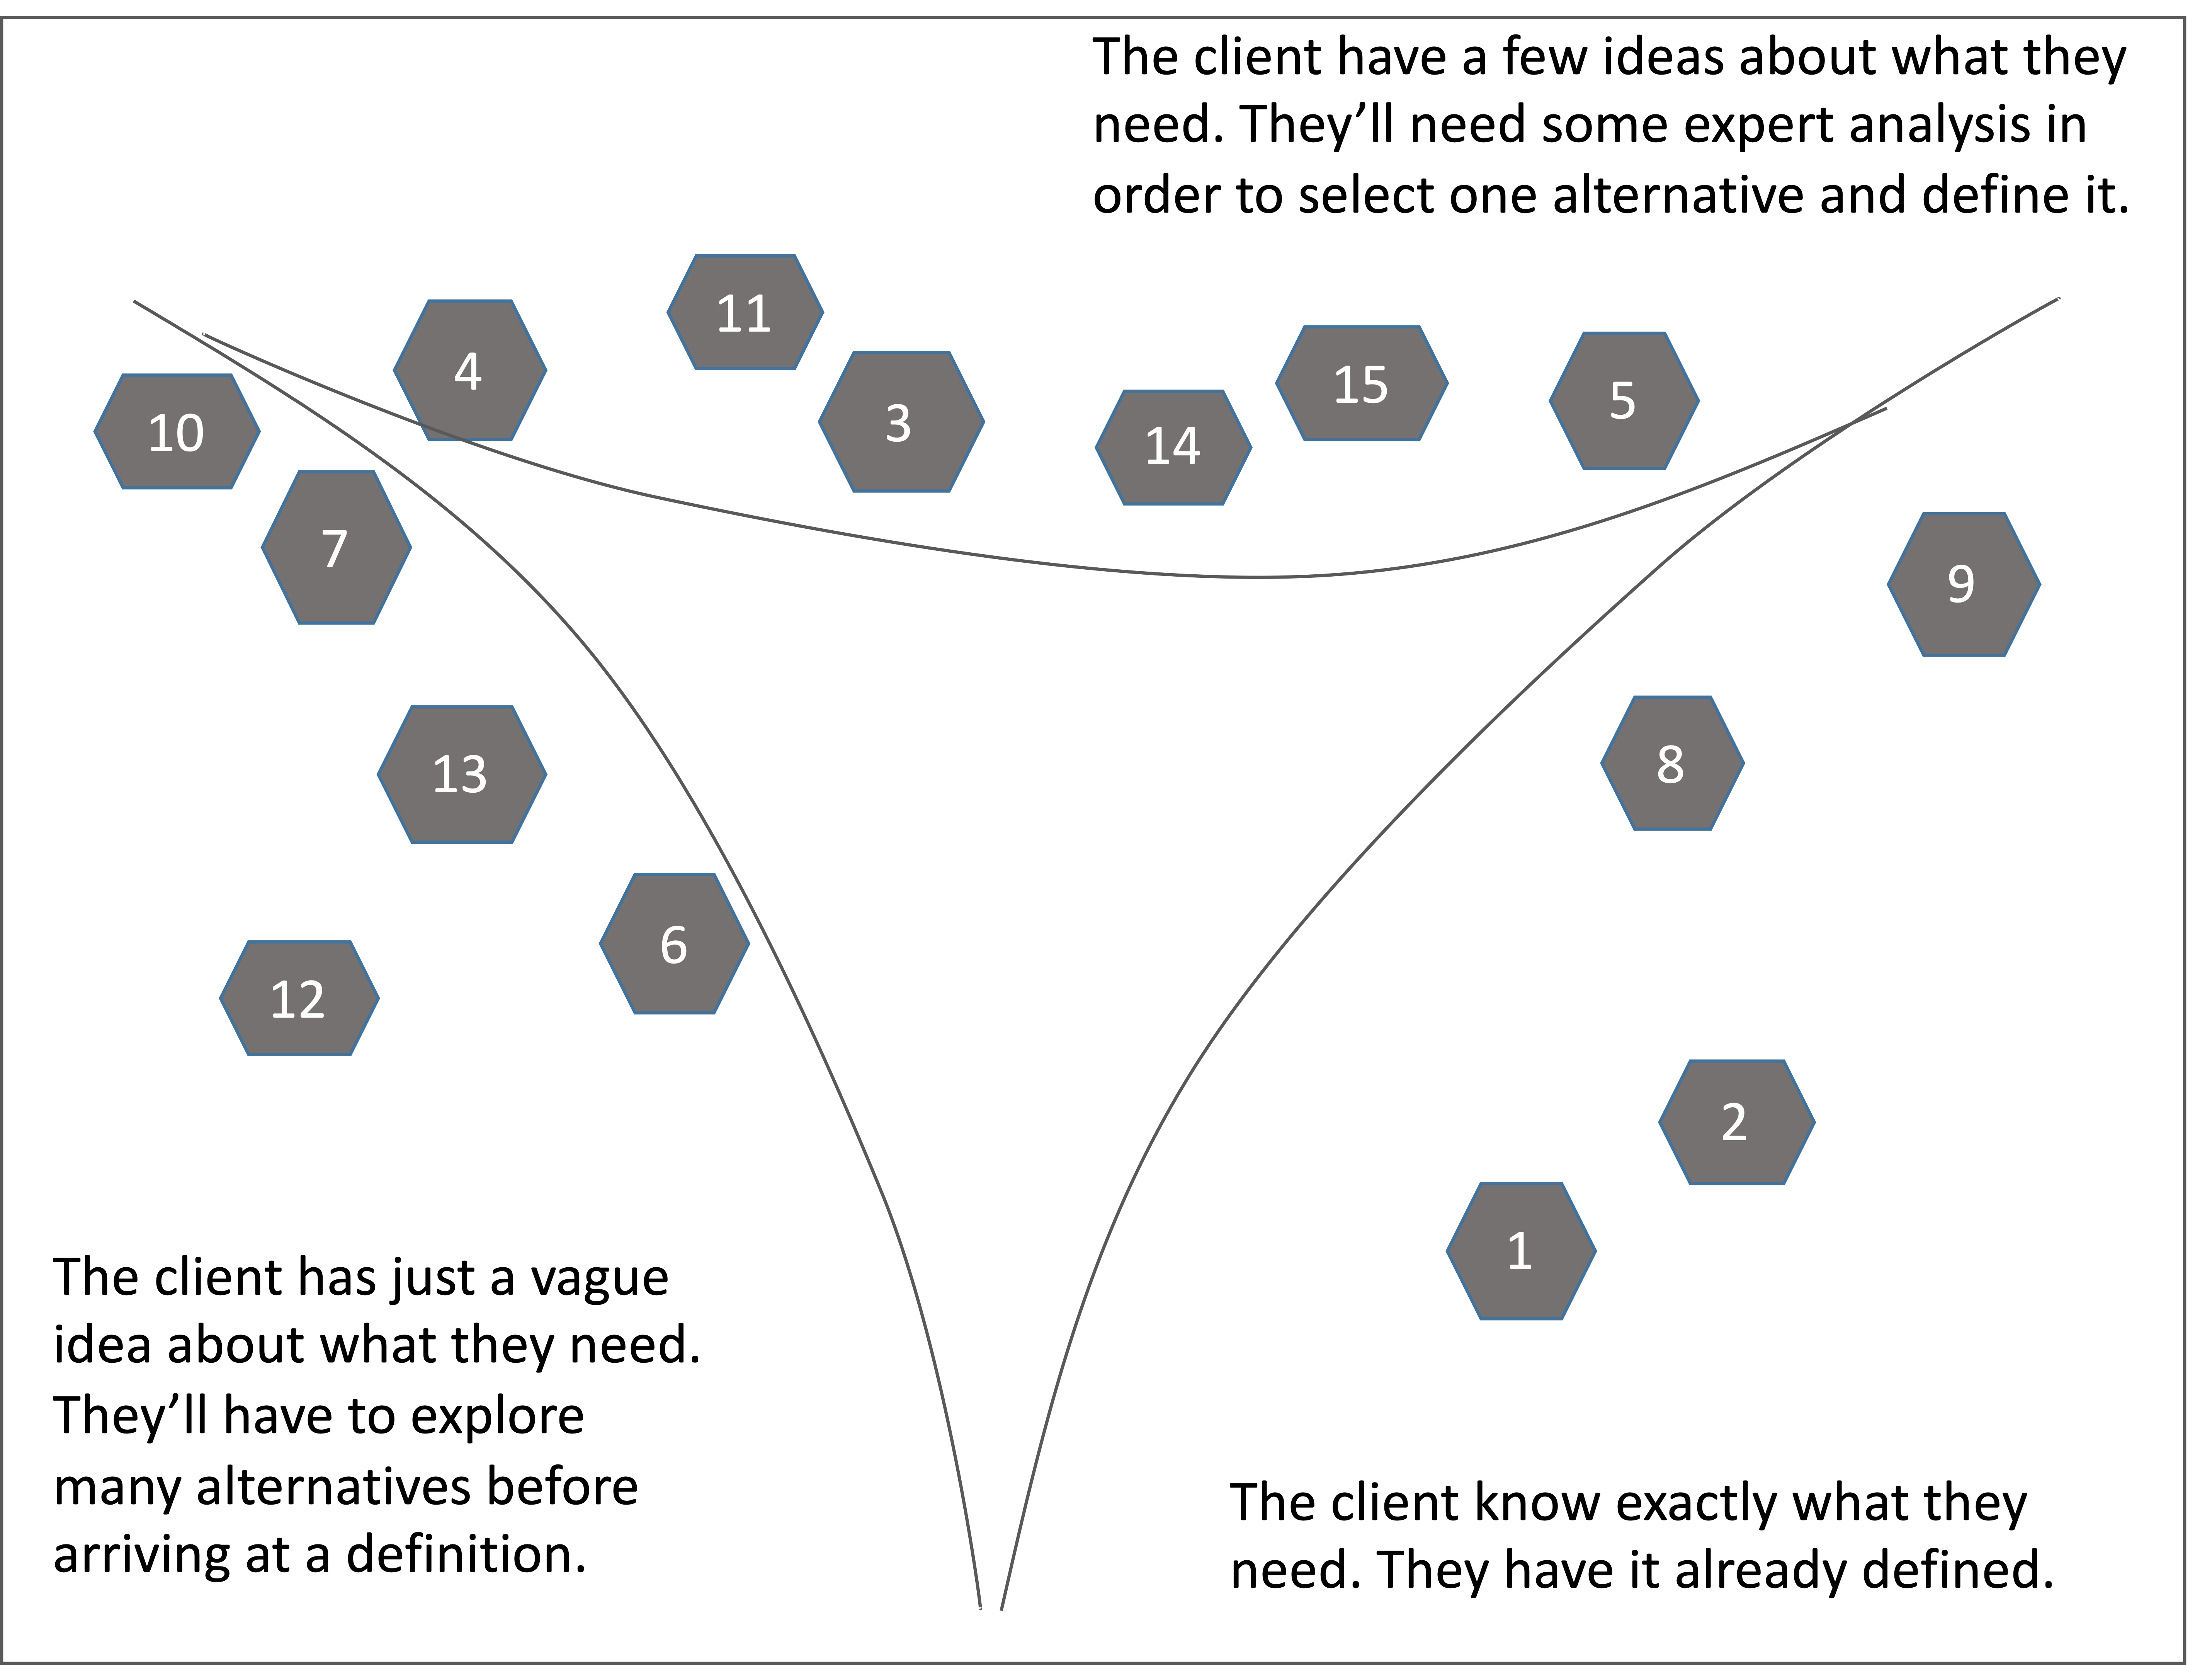
Cards can stay at a boundary but not in the central space. The central space is Confused and we want to get rid of it overtime, while we learn more about the nature of what we put in there. Eventually we want to be able to take action and what is in confused is not actionable.
Typically, the цардс that end up in the middle – it’s a problem of granularity. The option on the card is too big - part of may be complex and another part clear. The option is too big that’s why we can’t tell what kind of a problem it really is.
Figure 6: Contextualised Cynefin instance : Step 3
We take those cards in the middle of the flipchart and break it up into multiple cards. The goal is each of the new cards to fit in one of the three corners. By reducing the granularity of requirements, needs and capabilities we allow them to combine and recombine more readily to create more sustainable and resilient projects and activities. The result is shown on Figure 6
This is two stage emergence which is a key. We are breaking things down, then recombining them again in a different way, then repeating that process. This is designed to break entrained thinking, detect new patterns and gain new perspective and insight.
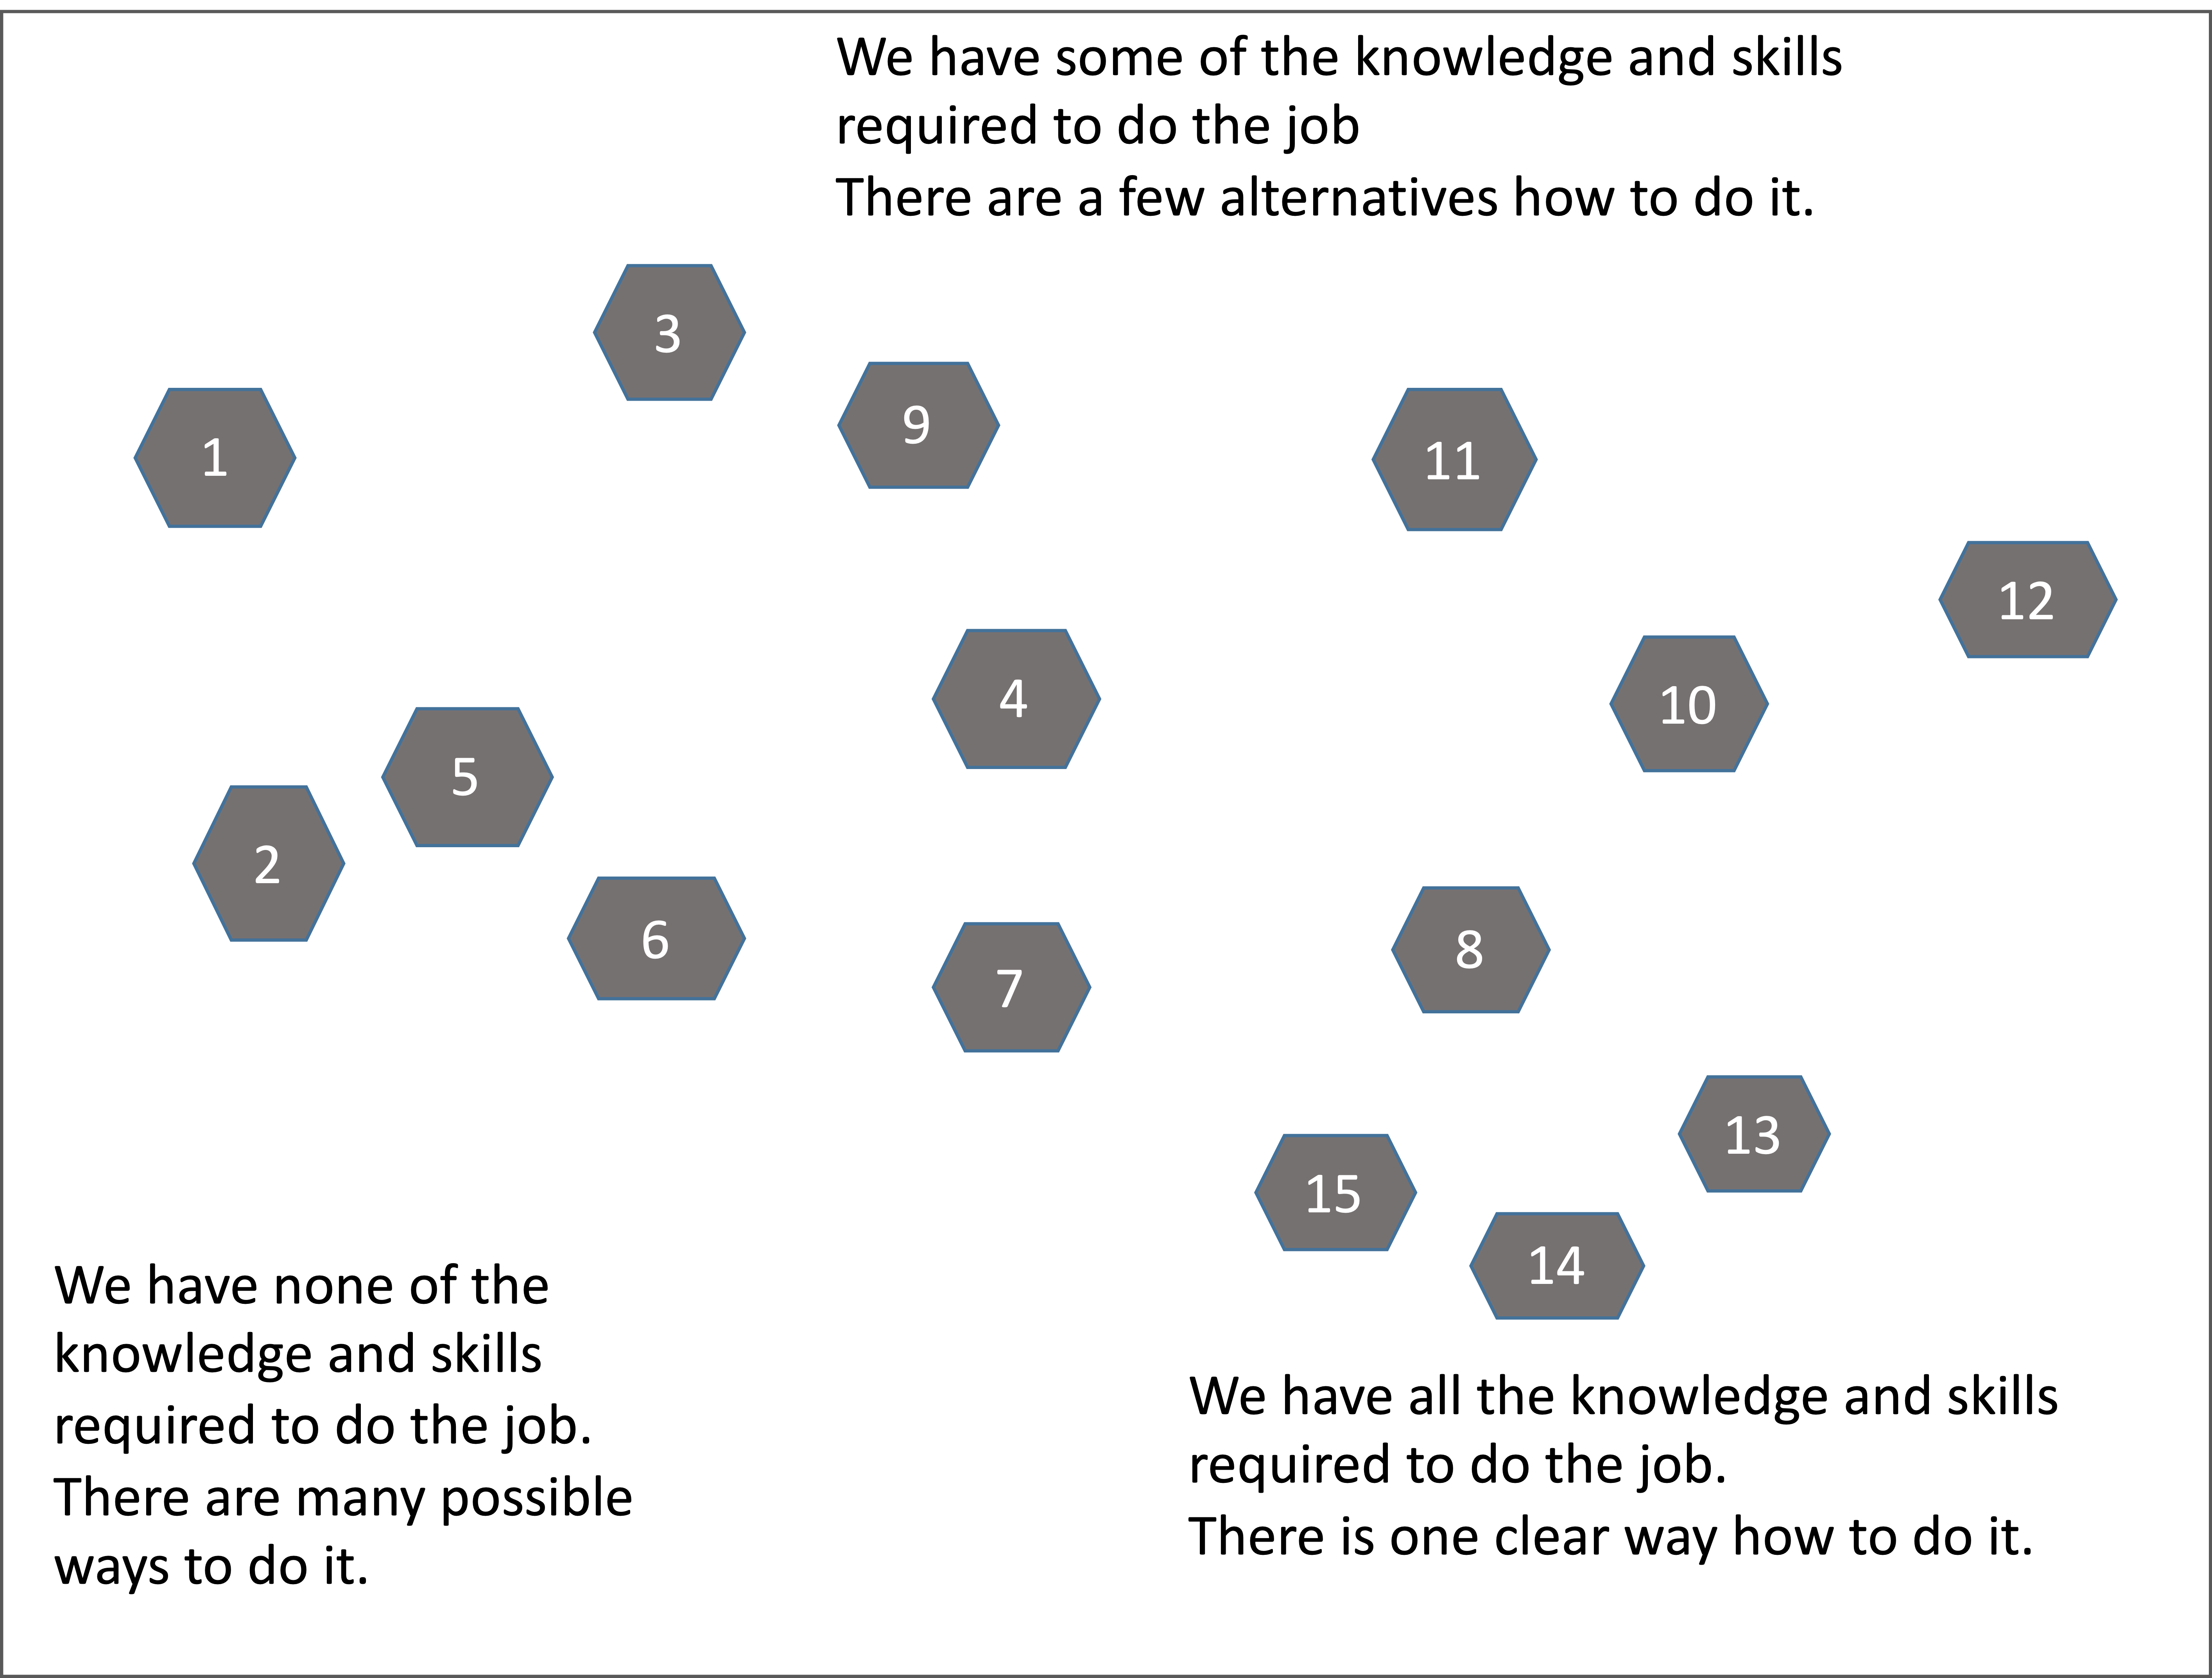
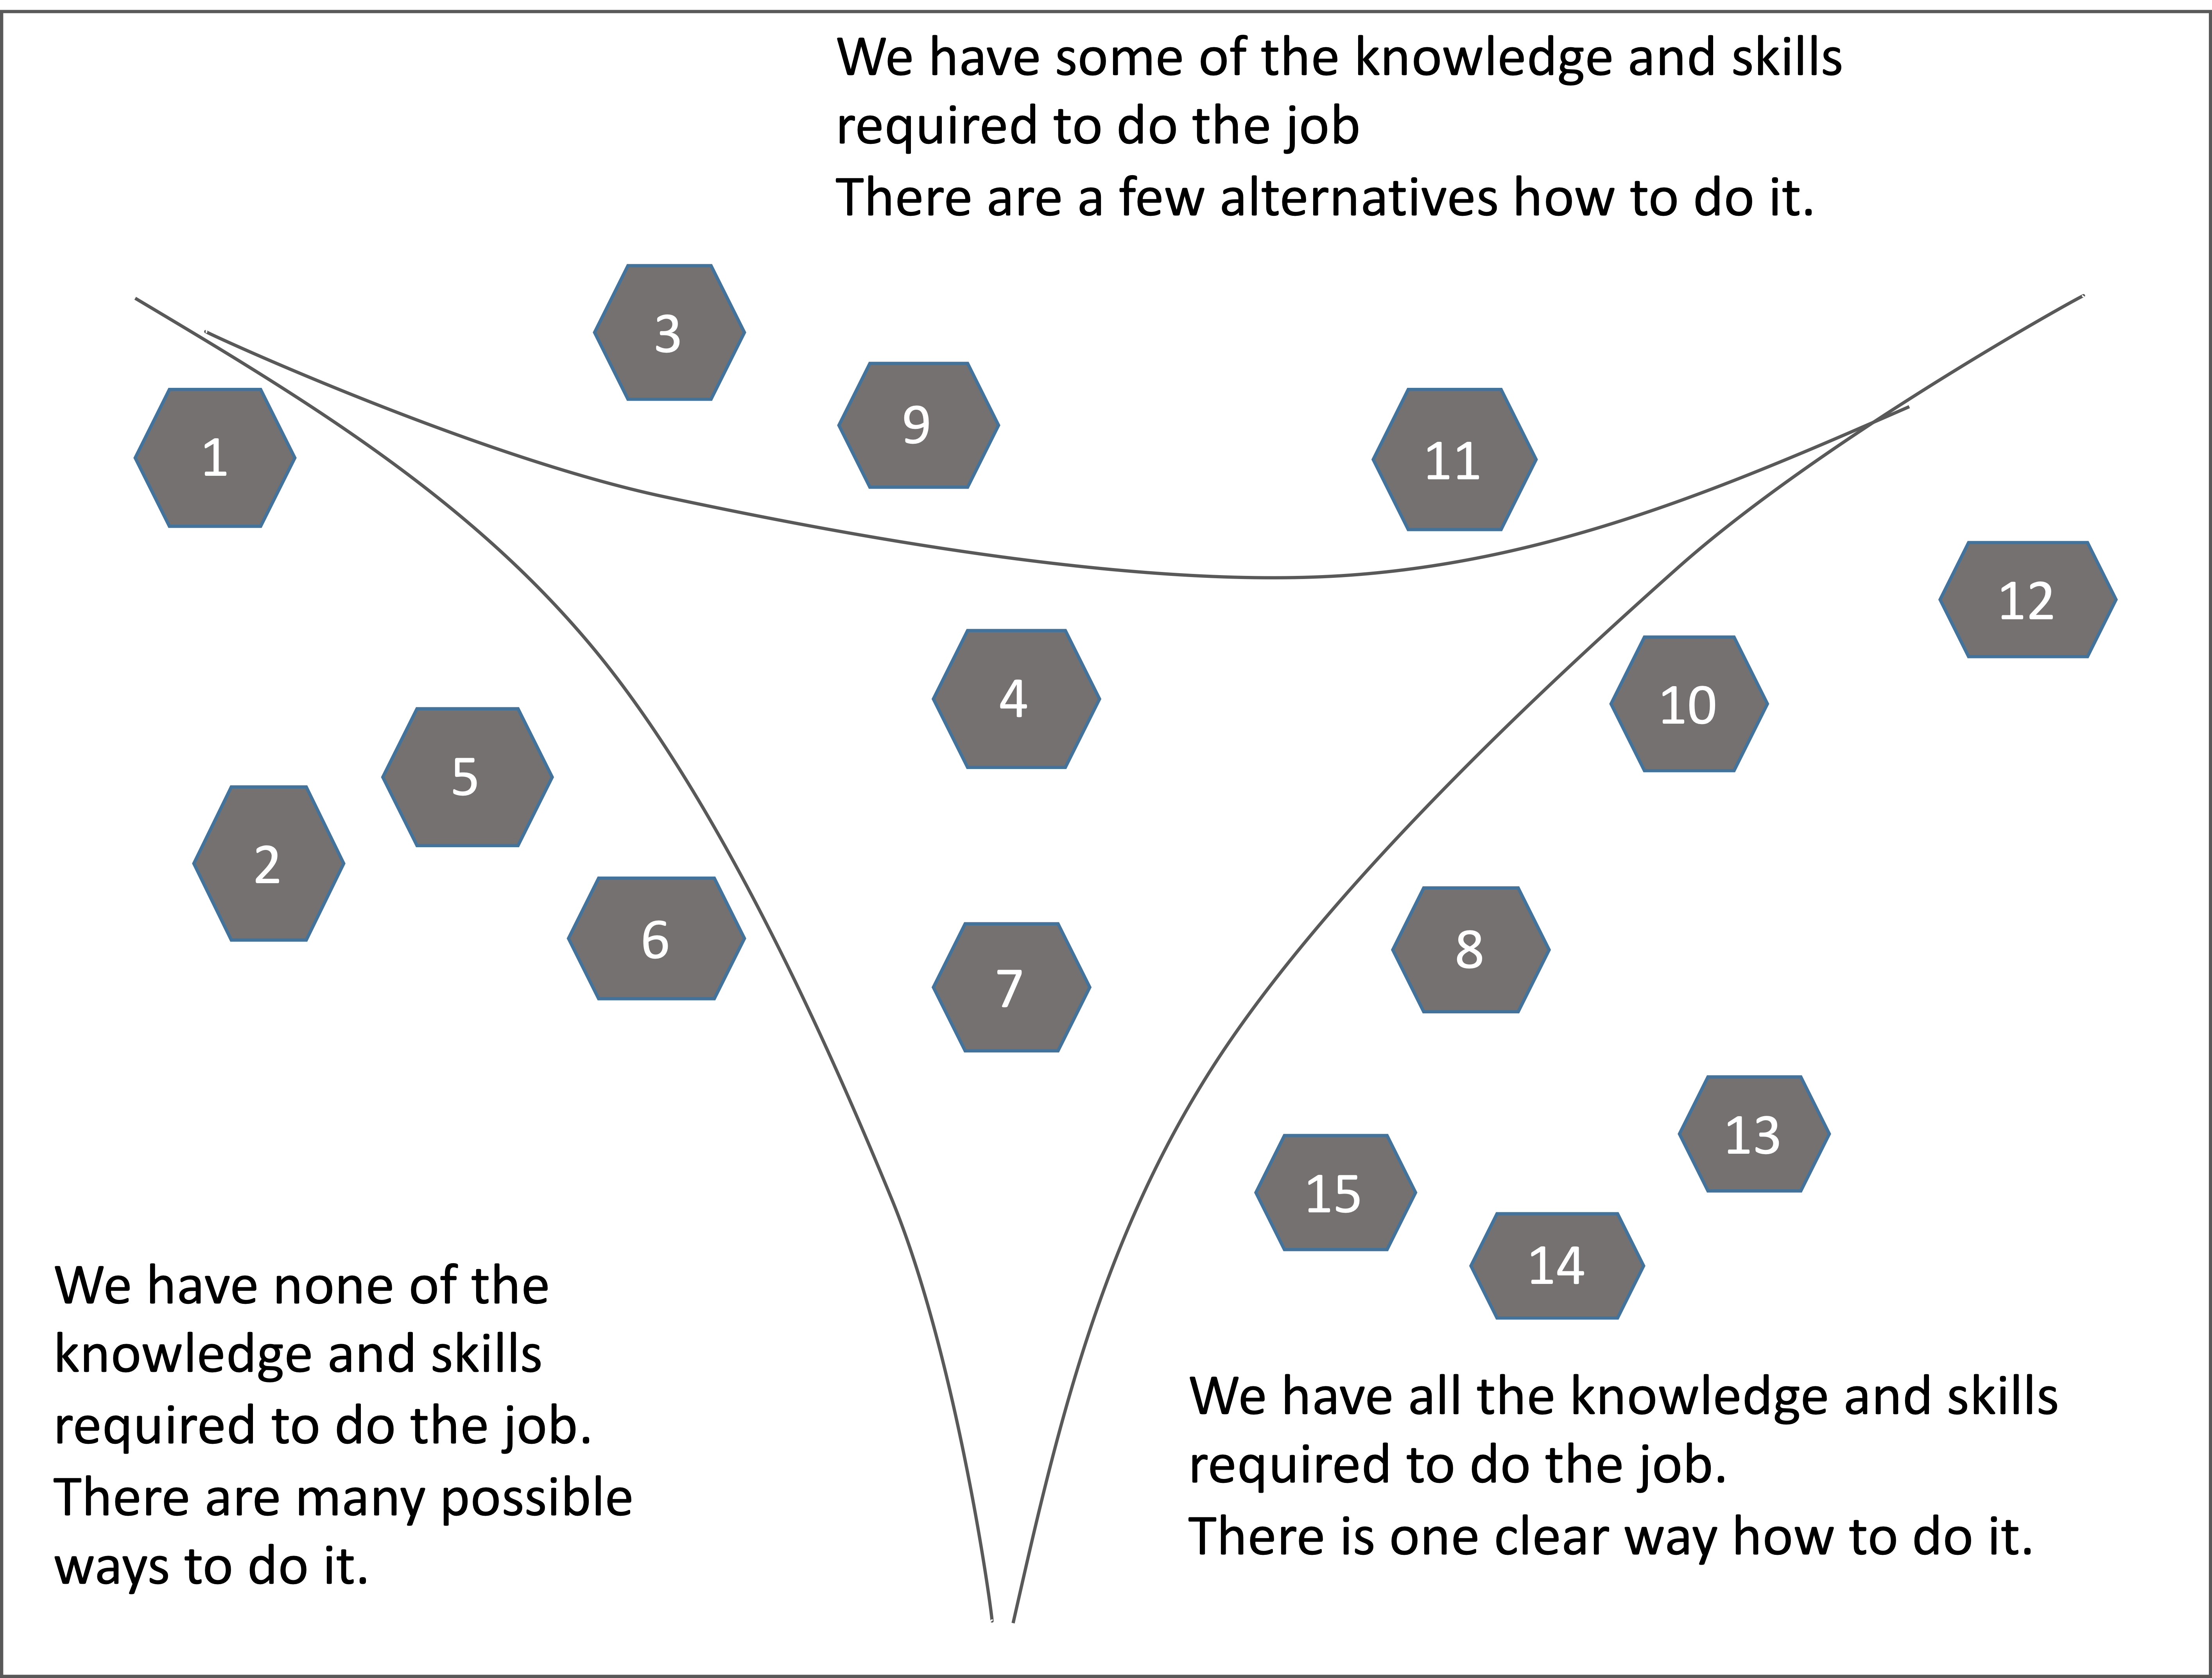
Next is to contextualize the same set of options but this tim from capability perspective. This time the labels will be different.They are focused on “how” to deliver the options.
The uncertainty about if our development capability would match the requirements defines the Cynefin domains for the Capability’s context. Again three cases:
- We have all the knowledge and skills required to do the job. We do it all the time. There is only one way to do it.(Clear)
- We have the knowledge and skills required to select from the few alternatives how to do the job. As experts we’ll research and analyze the alternatives because someone somewhere has done it before. (Complicated)
- We have none of the knowledge and skills required to do the job. We haven’t done it before and we’ll need to explore alternatives and build knowledge. (Complex)
Again we place the cards according to the three corners as shown on Figure 7. Here the case may be that we are not able to tell if we have the capability to deliver an option simply because the option itself is not clear enough from client perspective. This makes it complex from capability perspective as well.
As a general heuristic we need to be conservative and pessimistic. That means if an option is between clear and complicated then we put is in the complicated corner.
Figure 7: Contextualised Cynefin instance : Step 4
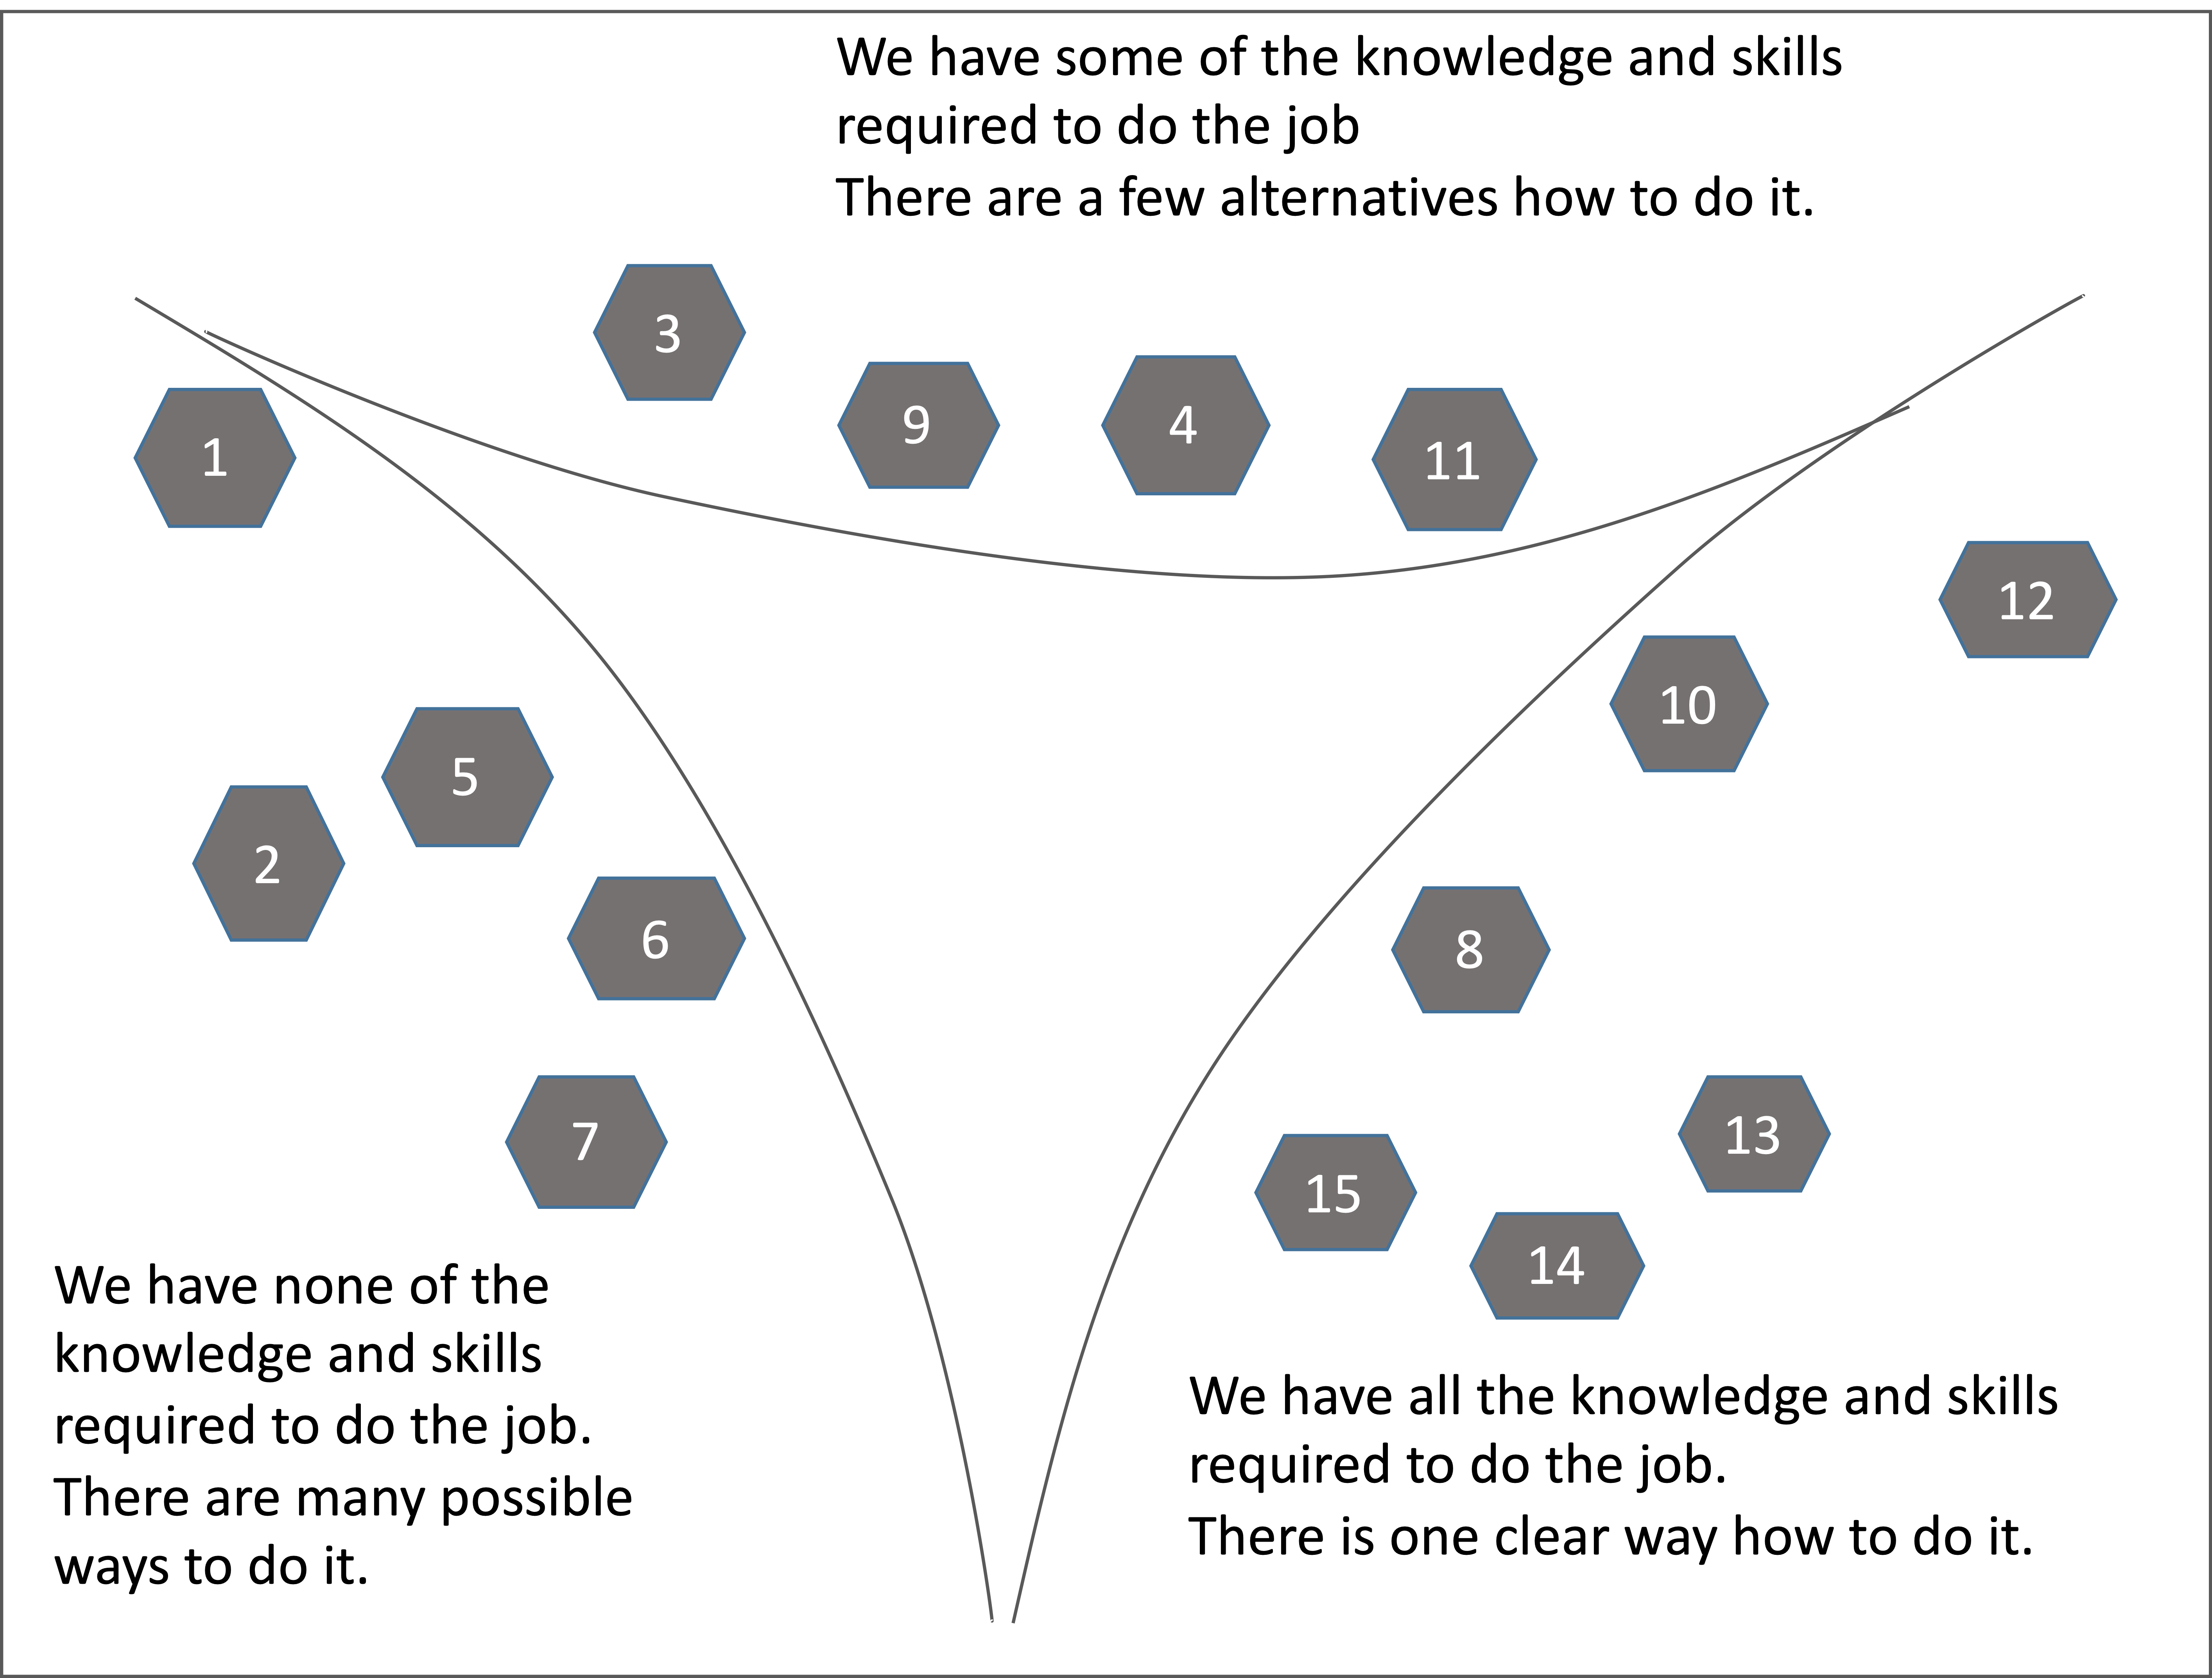
Then we draw the boundaries as shown on Figure 8.
Figure 8: Contextualised Cynefin instance : Step 5
Then we break down the options which are too big as shown on Figure 9.
Figure 9: Contextualised Cynefin instance : Step 6
Eventually, as shown on Figure 10, a Cynefin framework is created anew for each of the Capability and Client contexts.
Figure 10: Contextualised Cynefin instance : Step 7
CATEGORIZATION
We will use the contextualized Cynefin frameworks for categorisation in the unique context of the project. Our goal is to combine the two perspectives into one that we can use operationally.
Here is how we do that.
First we create a space with horizontal and vertical axeis as presented on Figure 11. On the horizontal axis we have the level of constraints from capability perspective. On the vertical axis we have the level of constraints from client context. The level of constrains will be qualitative. 
Figure 11: Complexity space : Step 1
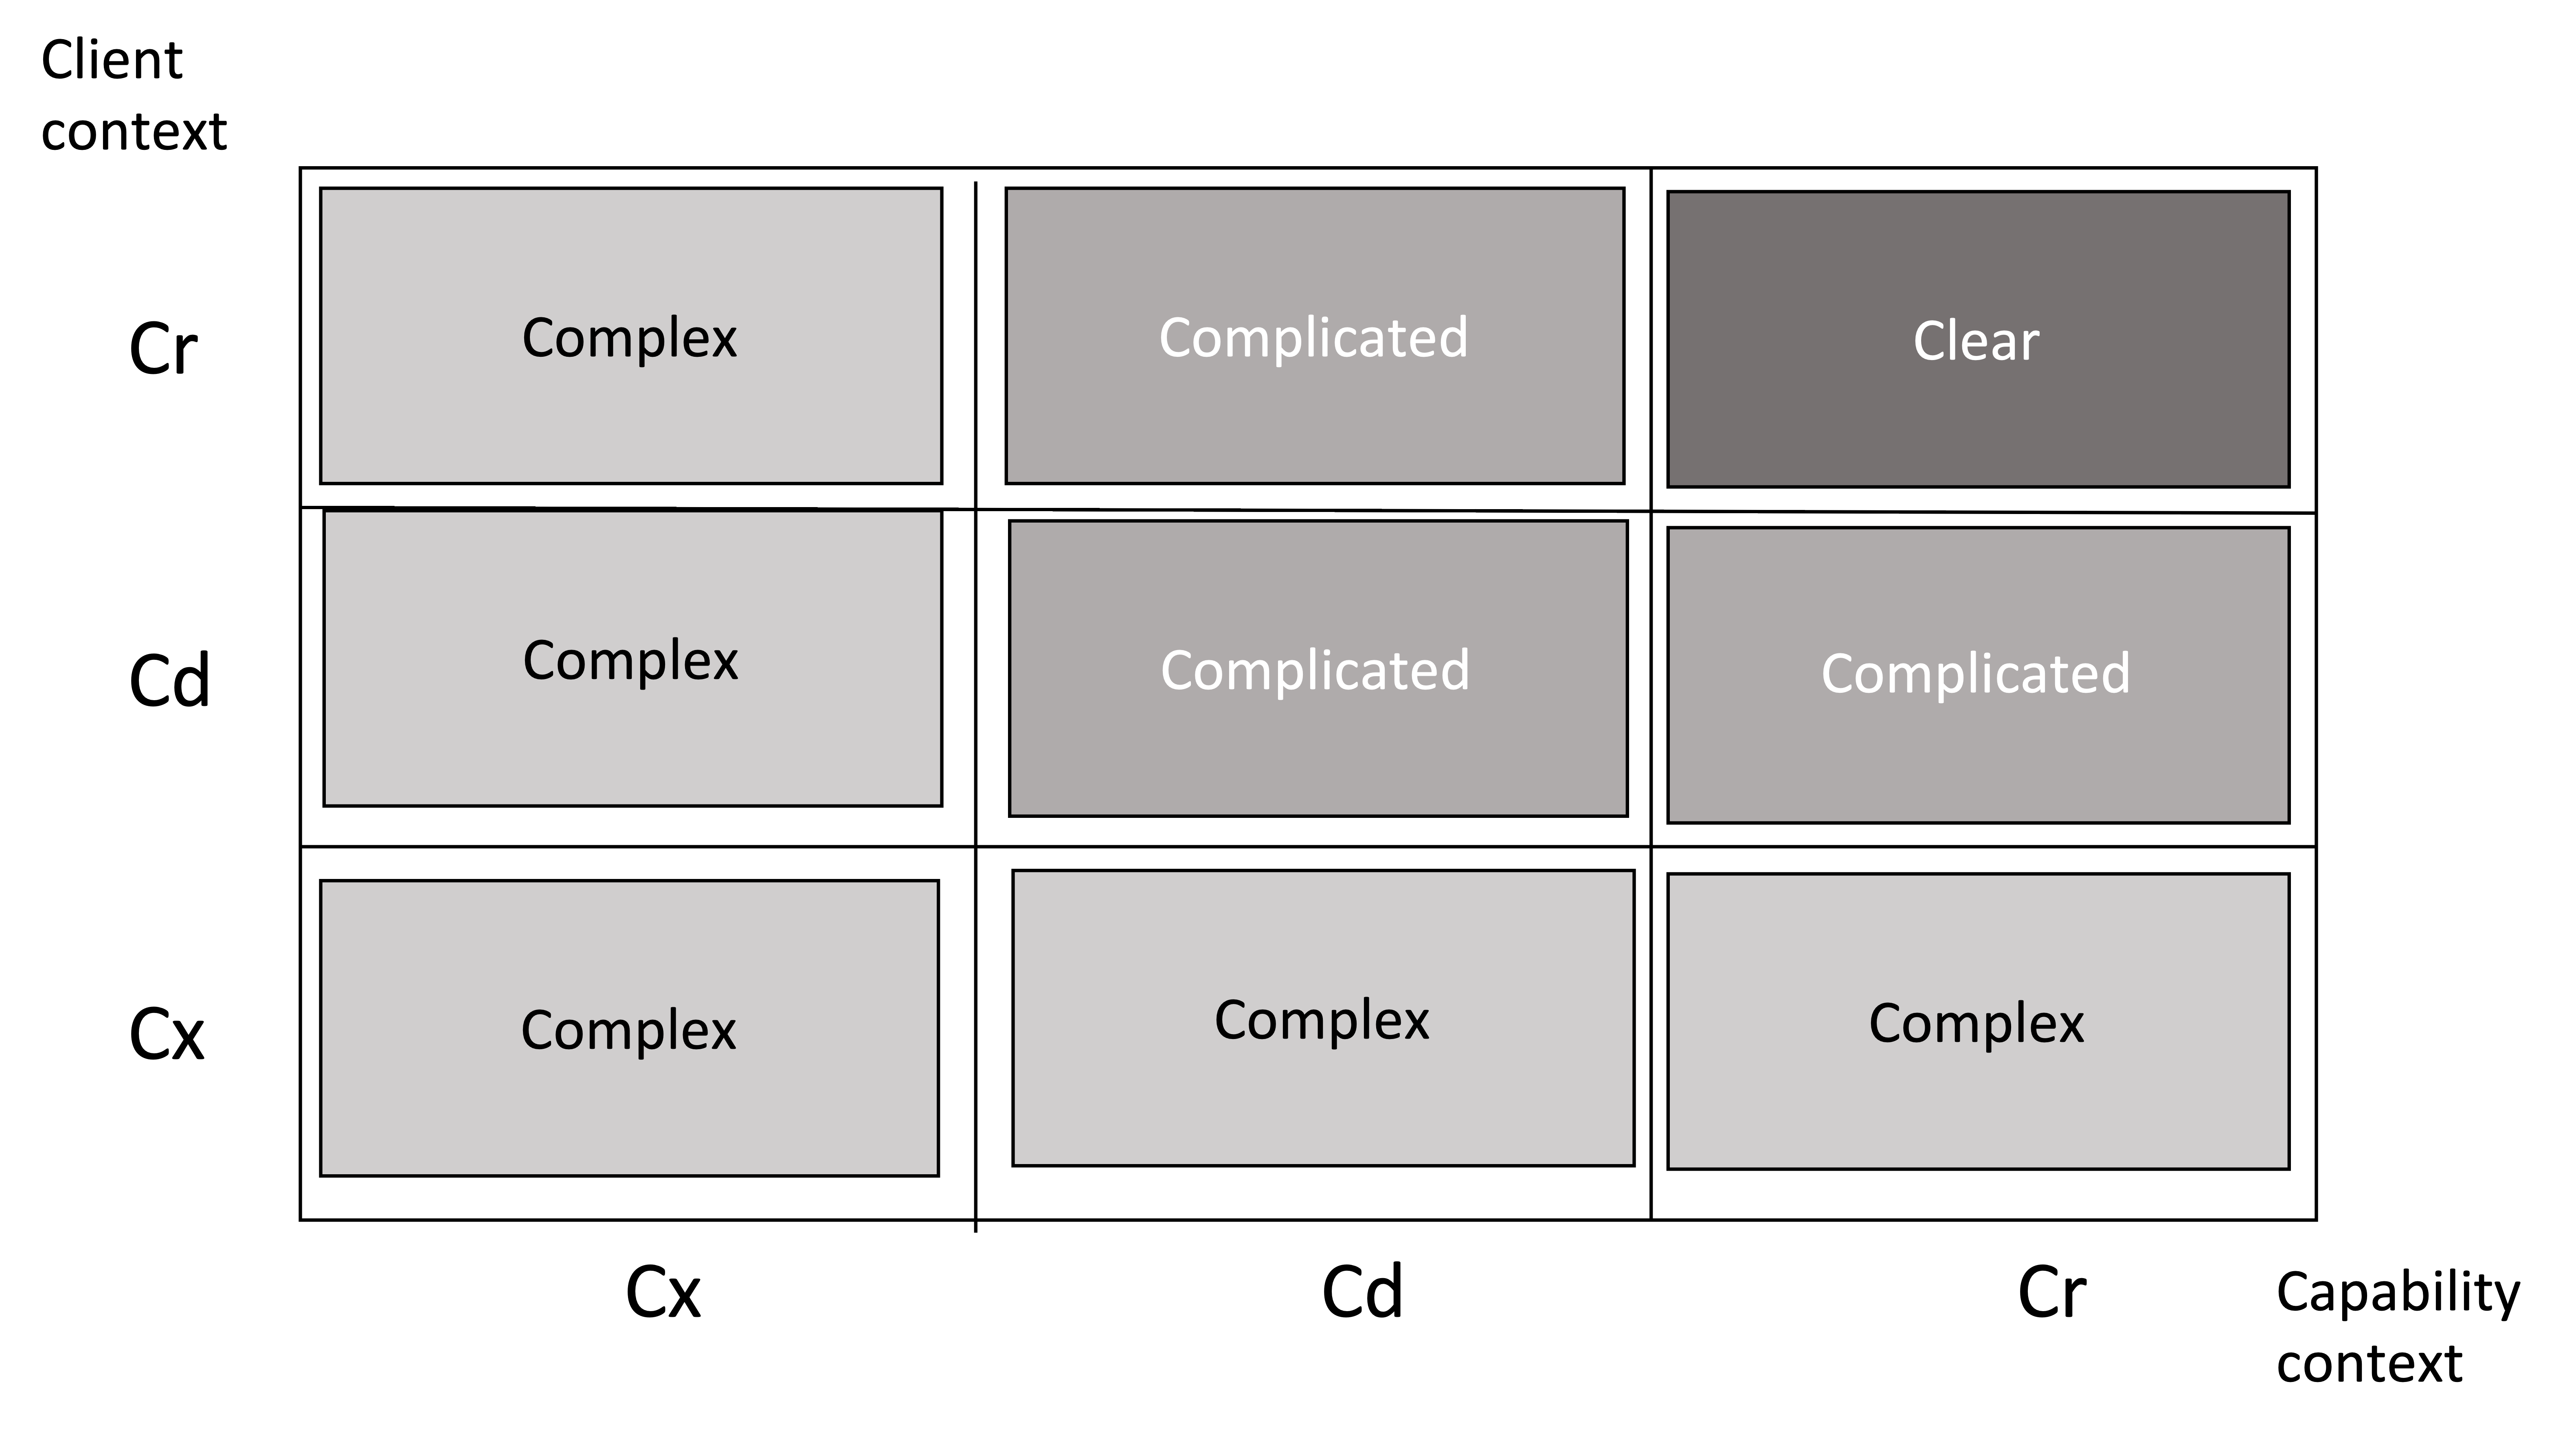
Being aware of the Cynefin framework we can easily put some labels on both the horizontal and on the vertical axises. They map easily to the three Cynefin domains - Clear, Complicated and Complex as presented on Figure 12. The Chaos domain is also present on the diagram. It is the point 0 - where there are no constraints neither form capability nor from client perspective.
Figure 12: Complexity space : Step 2
In order to make the diagram more tidy we will put “Cr” for Clear, “Cd” for Complicated and “Cx” for Complex. The result is presented on Figure 13.
Figure 13: Complexity space : Step 3
The Complexity profile (CP) of our project is presented on Figure 14. It represents the uncertainty about the options we'll need to deliver.
Figure 14: Complexity profile (CP)
We match the options from each Cynefin framework indexed by their complexity profile. We do so by taking each of the options and place them in the respective cell from the complexity profile.
If an option is part of a Complex domain either from client or from capability perspective, it is considered Complex. If an option is part of a Complicated domain either from client or from capability perspective, it is Complicated. Clear are only user stories which are Clear in both perspectives.
Here a question is usually reais: why we need the CP, why don’t we just place the options in the table as bellow?
| User Story |
Capability Context |
Client Context |
Complexity profile |
#1 |
Complex |
Clear |
Complex |
… |
… |
… |
… |
#5 |
Complex |
Complicated |
Complex |
… |
… |
… |
… |
#14 |
Clear |
Clear |
Clear |
#15 |
Clear |
Complicated |
Complicated |
We don’t use only the table above because we want to show the movement inside the complexity profile. That means to make to complex things complicated and the complicated things clear.
MOVEMENT
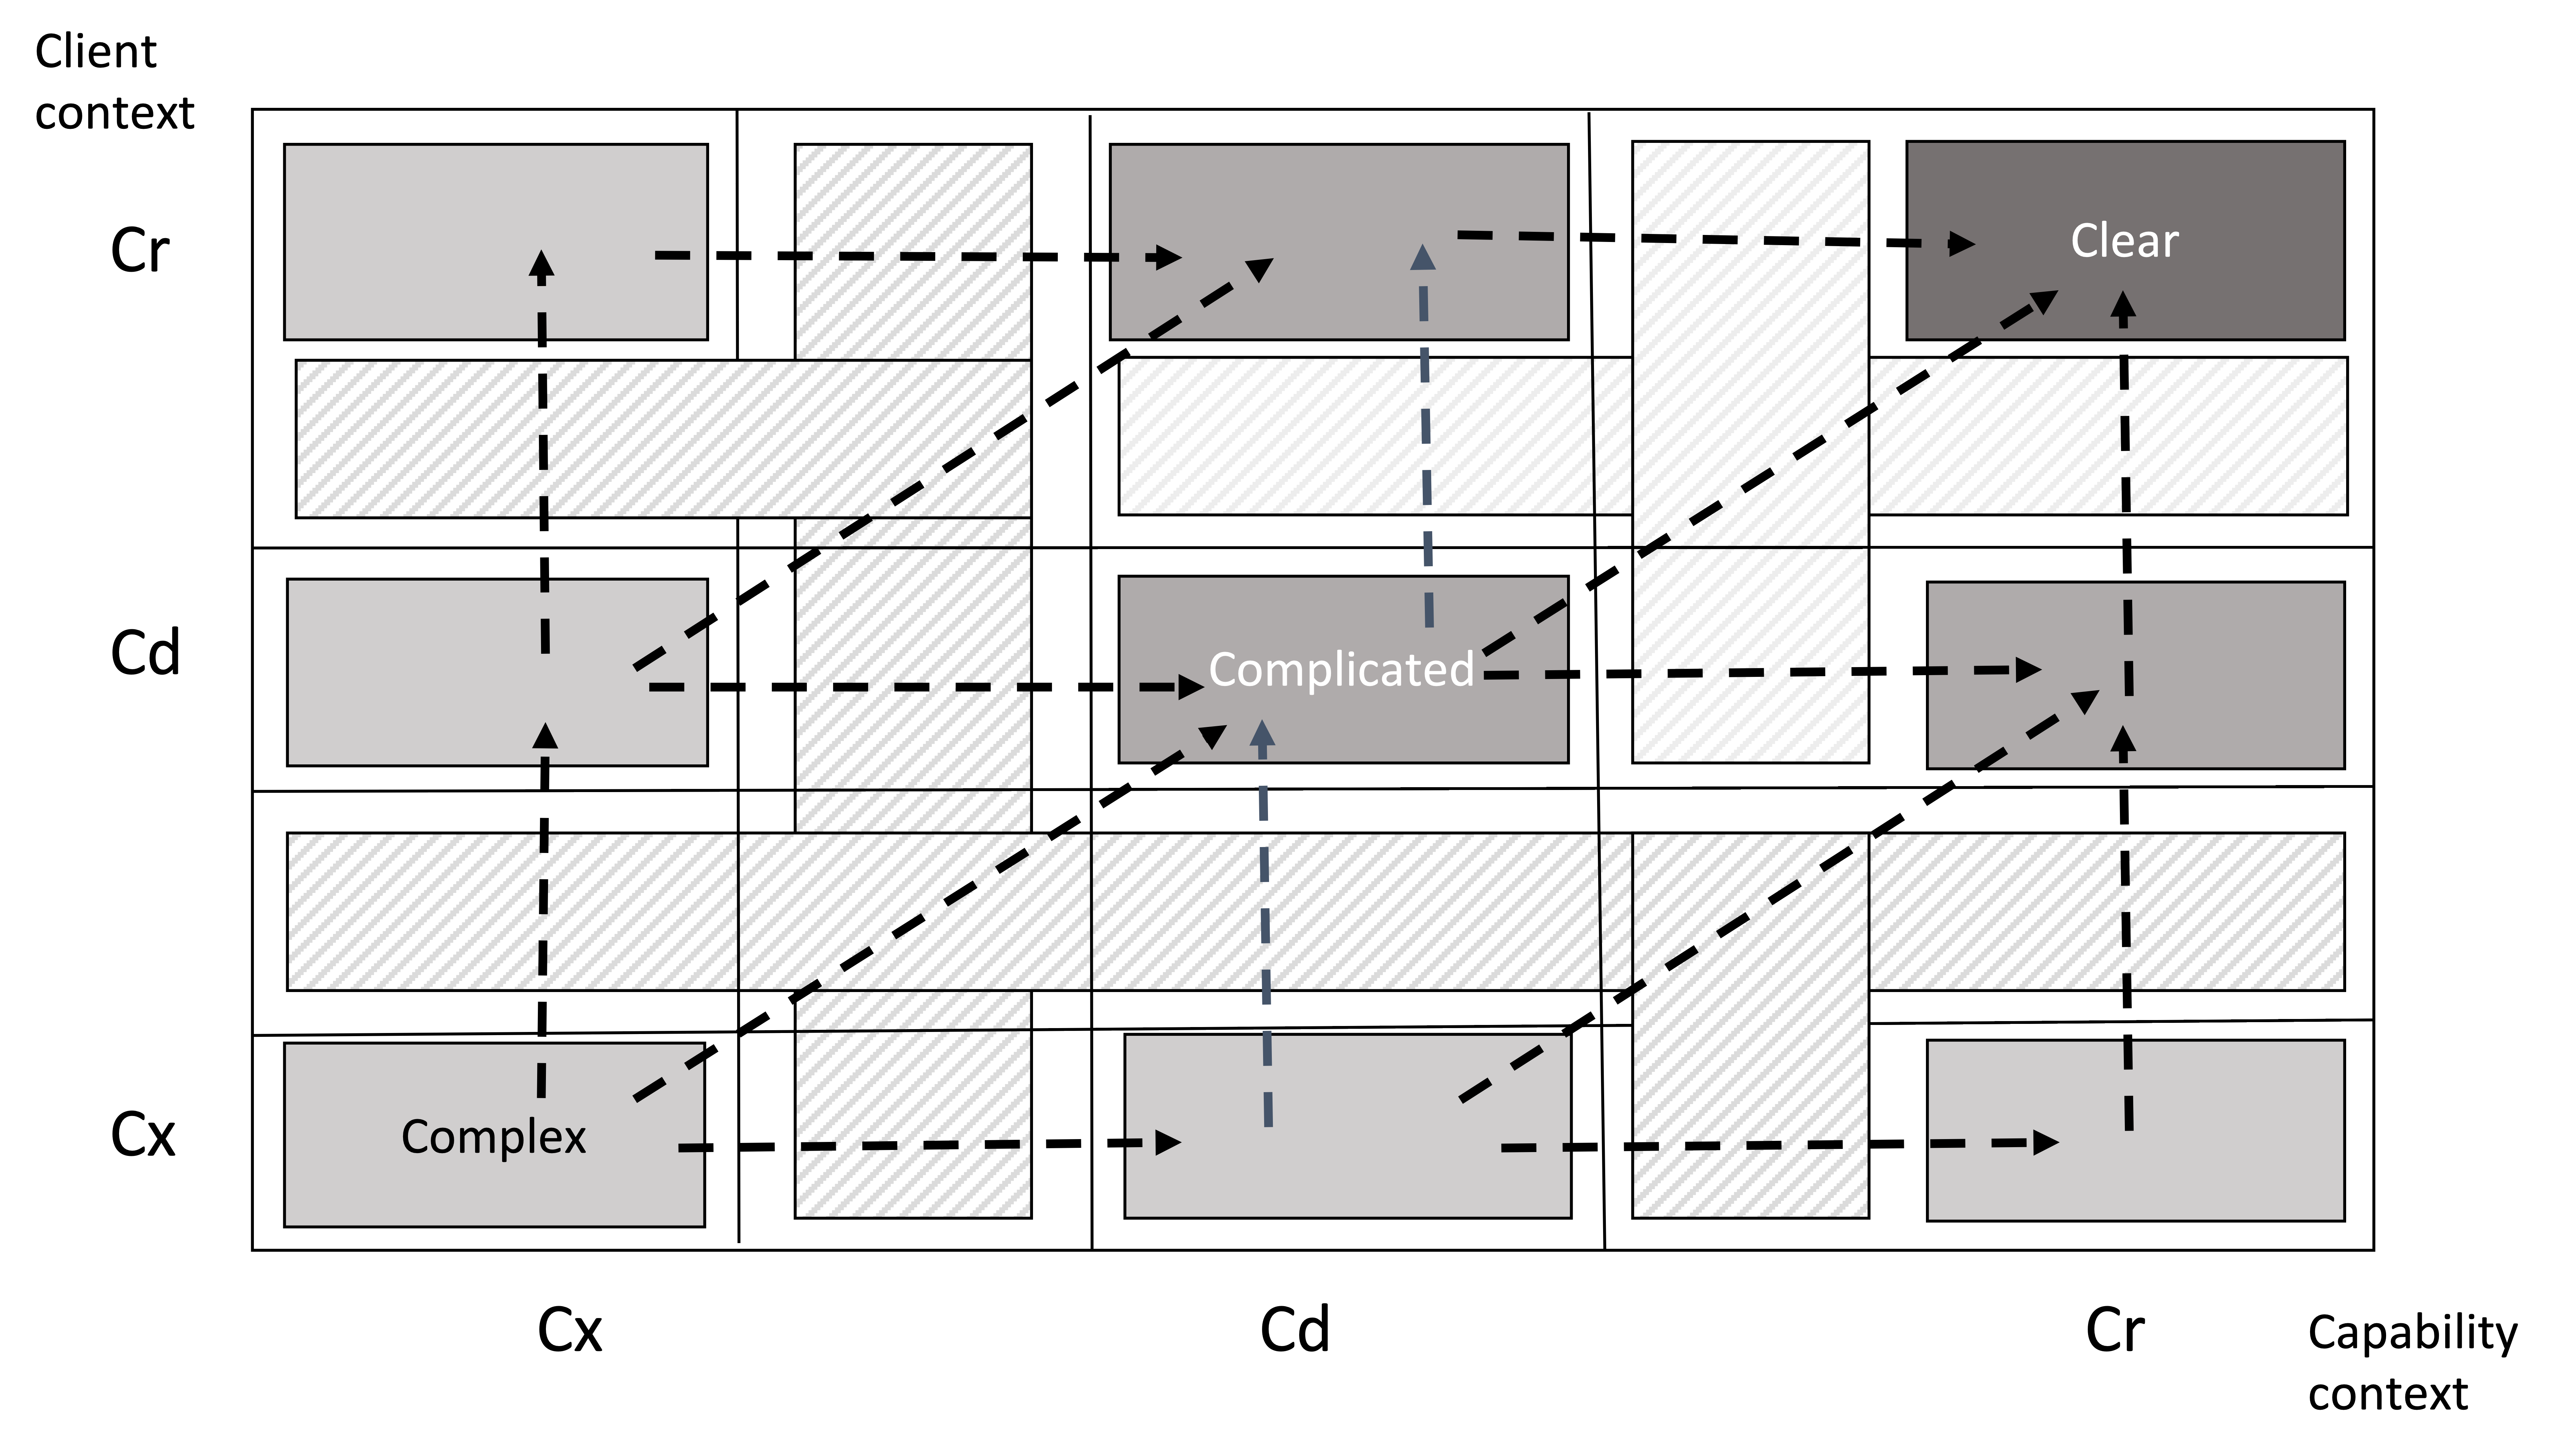
A complexity profile is a manuvareble space. All possible movements between domains are presented bellow.
Figure 15: Three types of systems
The base movement is to clarify the complex options and make them complicated. When we have a vague idea we prepare a concept with a couple of alternatives. This way we have made the option complicated. This movement represents accumulation of knowledge about the problem and skills to solve it. It is a knowledge discovery process.
For example, if we want to move an option from cell CxCx to cell CdCd we have several alternative routes:
- Linearly CxCx -> CdCx -> CdCd
- Linearly CxCx -> CxCd -> CdCd
- Diagonally from CxCx to CdCd, which means we clarify both from capability and from client perspectives
We see also the transition states between the cells. They are presented in stripes. An option is in a transition state when it has left a cell but hasn’t got into a new cell yet. That means a work is being done to clarify the option.
For example, if from capability perspective an option is complex I.e. we don’t know how to implement it and we decide to do a PoC. Then the card will follow CxCx -> CdCx -> CdCd, and stay in transition until the PoC provides results.
Another example: if an option is complex from client perspective then the capability could work with the client by presenting alternatives. This is what software development experts do - we provide alternatives not only about how to do but also what to do. When providing alternatives to the client about what to be done we have the chance to move the work through the CP in a direction that suits us best as capability. One may say that client who don’t know what they want are the best!
We see that the complexity profile serves us as a map to show as how we can move to reach our target position. It helps us act in order to move in two-dimensions.
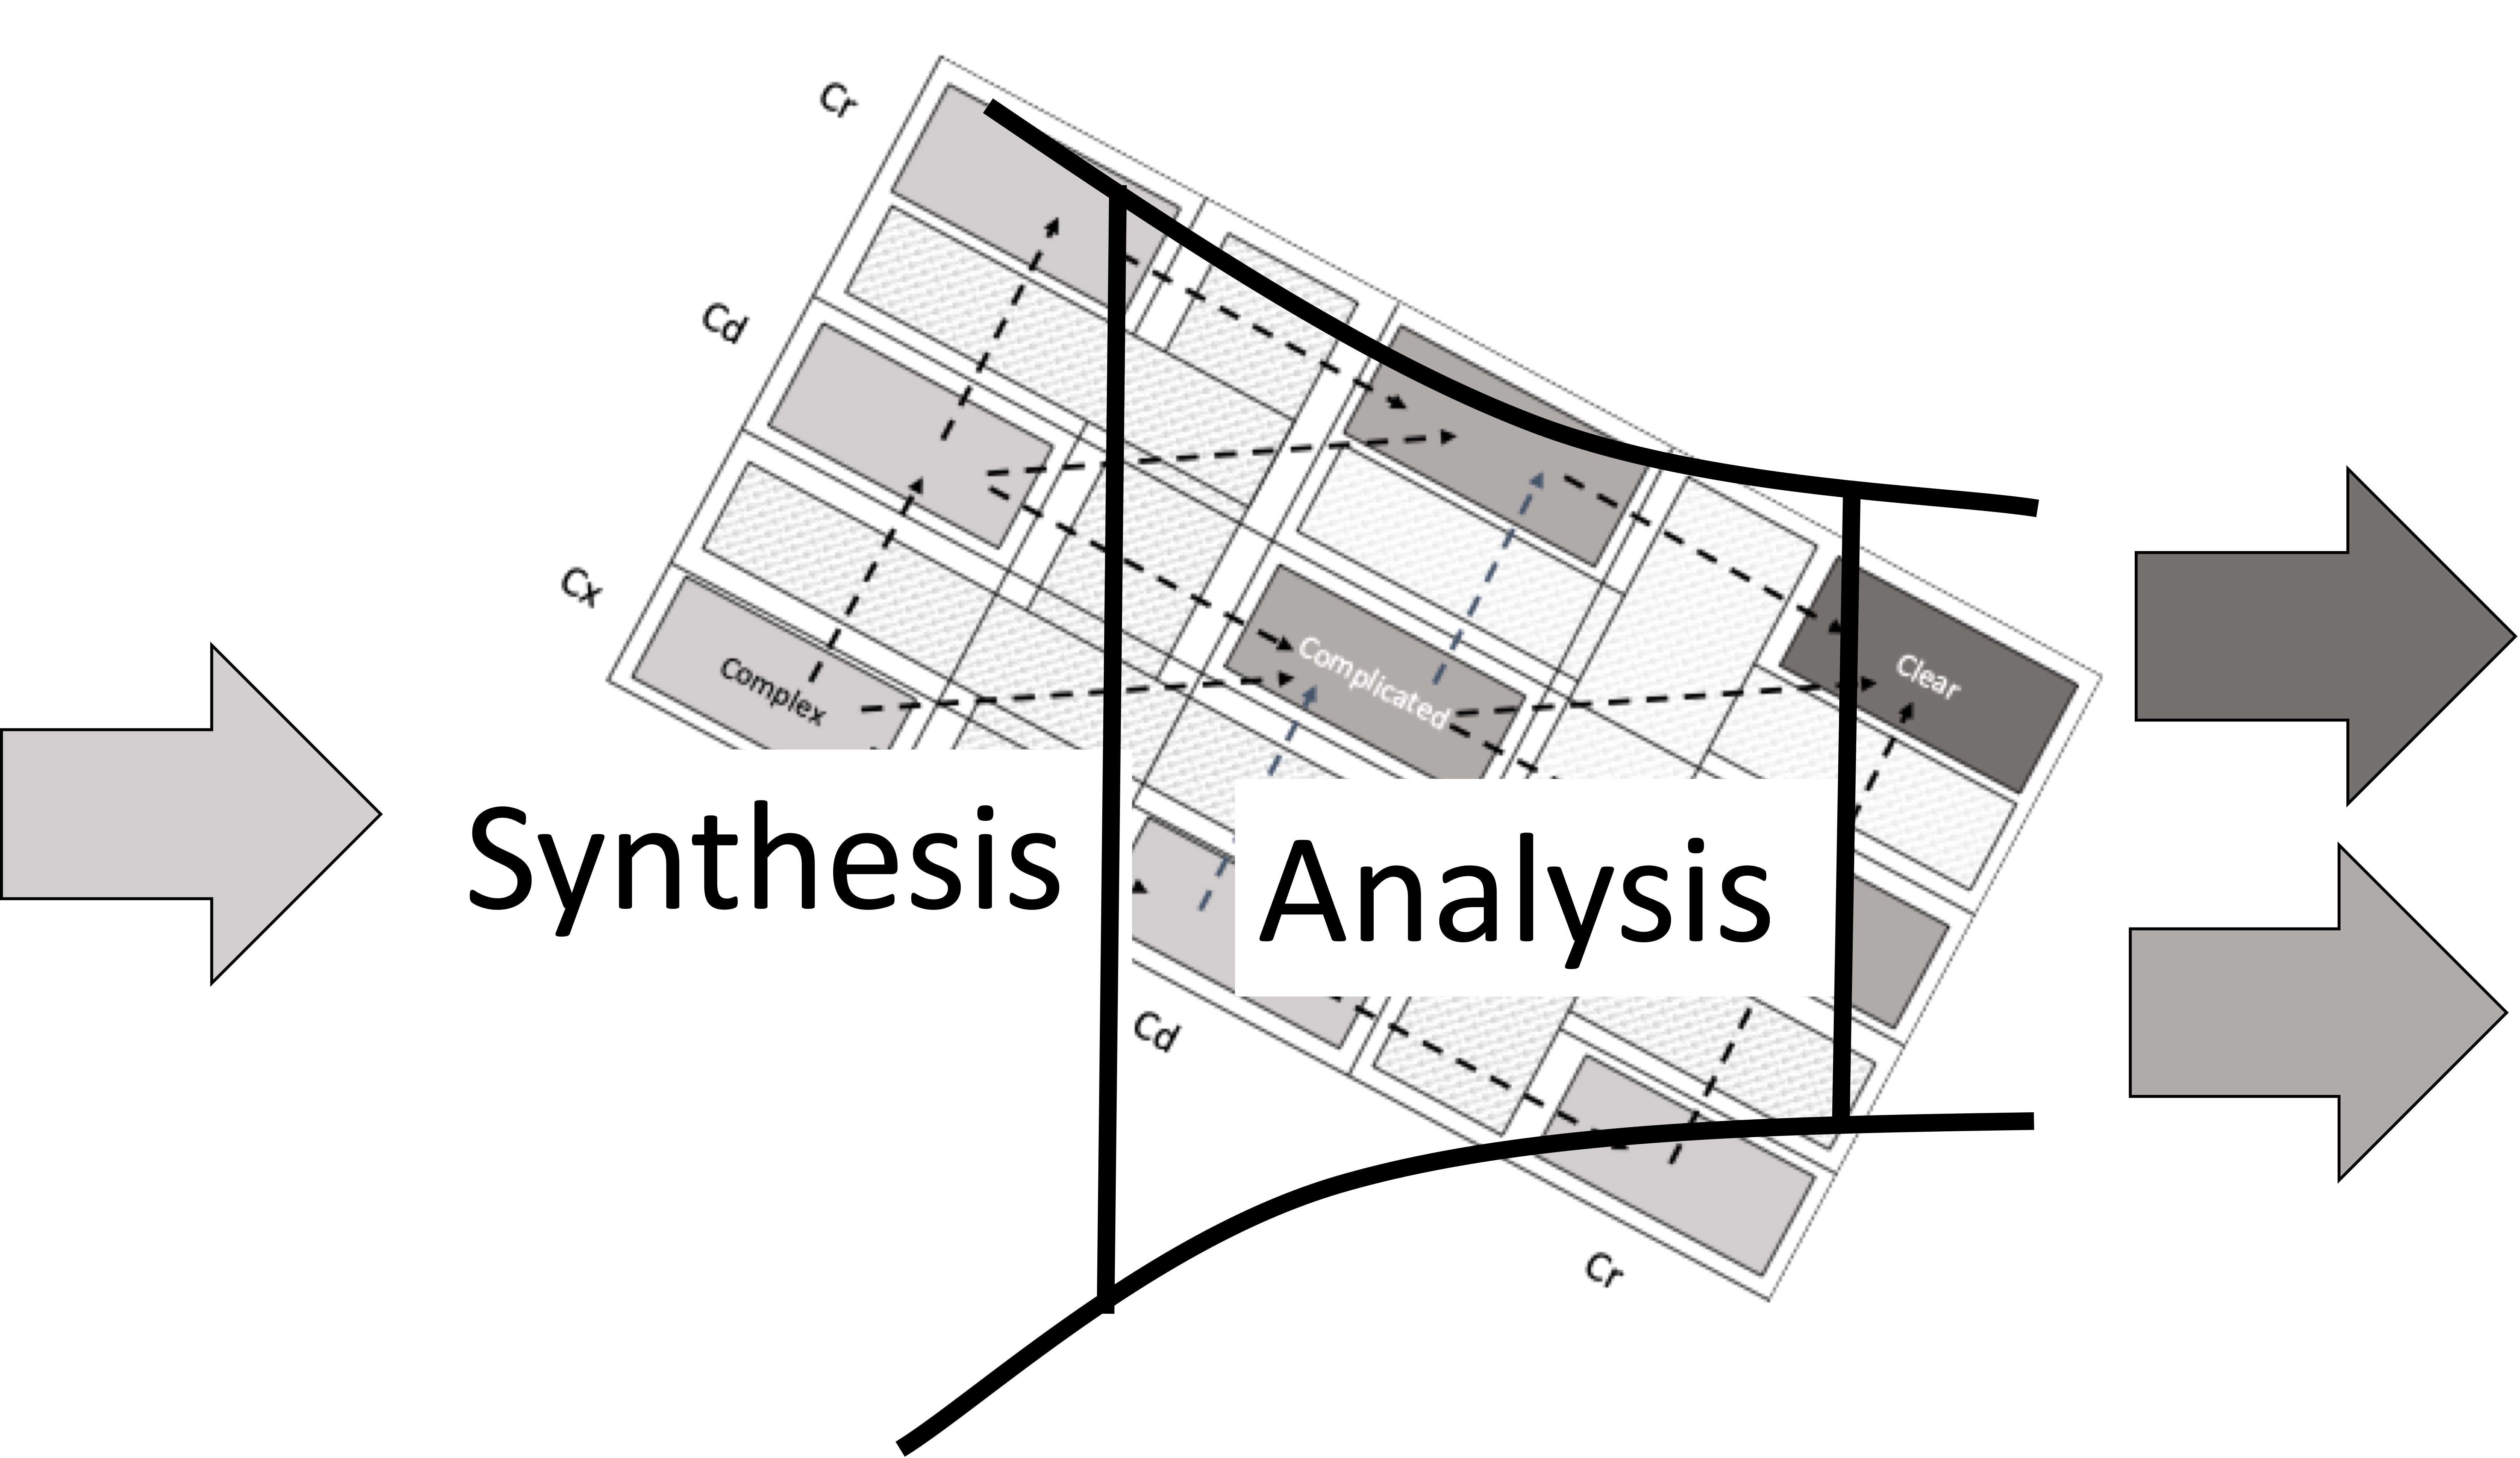
This dynamic can be presented in a simpler way as a movement through a funnel as shown on Figure 16.
Figure 16: Options funnel
Imagine that we have rotated the complexity profile 45 degrees so that the lines of movement from complex to complicated and from complicated to clear are horizontal. Synthesis is the process of making complex things complicated. An example is to observe the market . Using analysis we make the complicated options clear or pick one of the good alternatives. And example is analyzing how to design a technical system or a user interface.
KANBAN BOARD
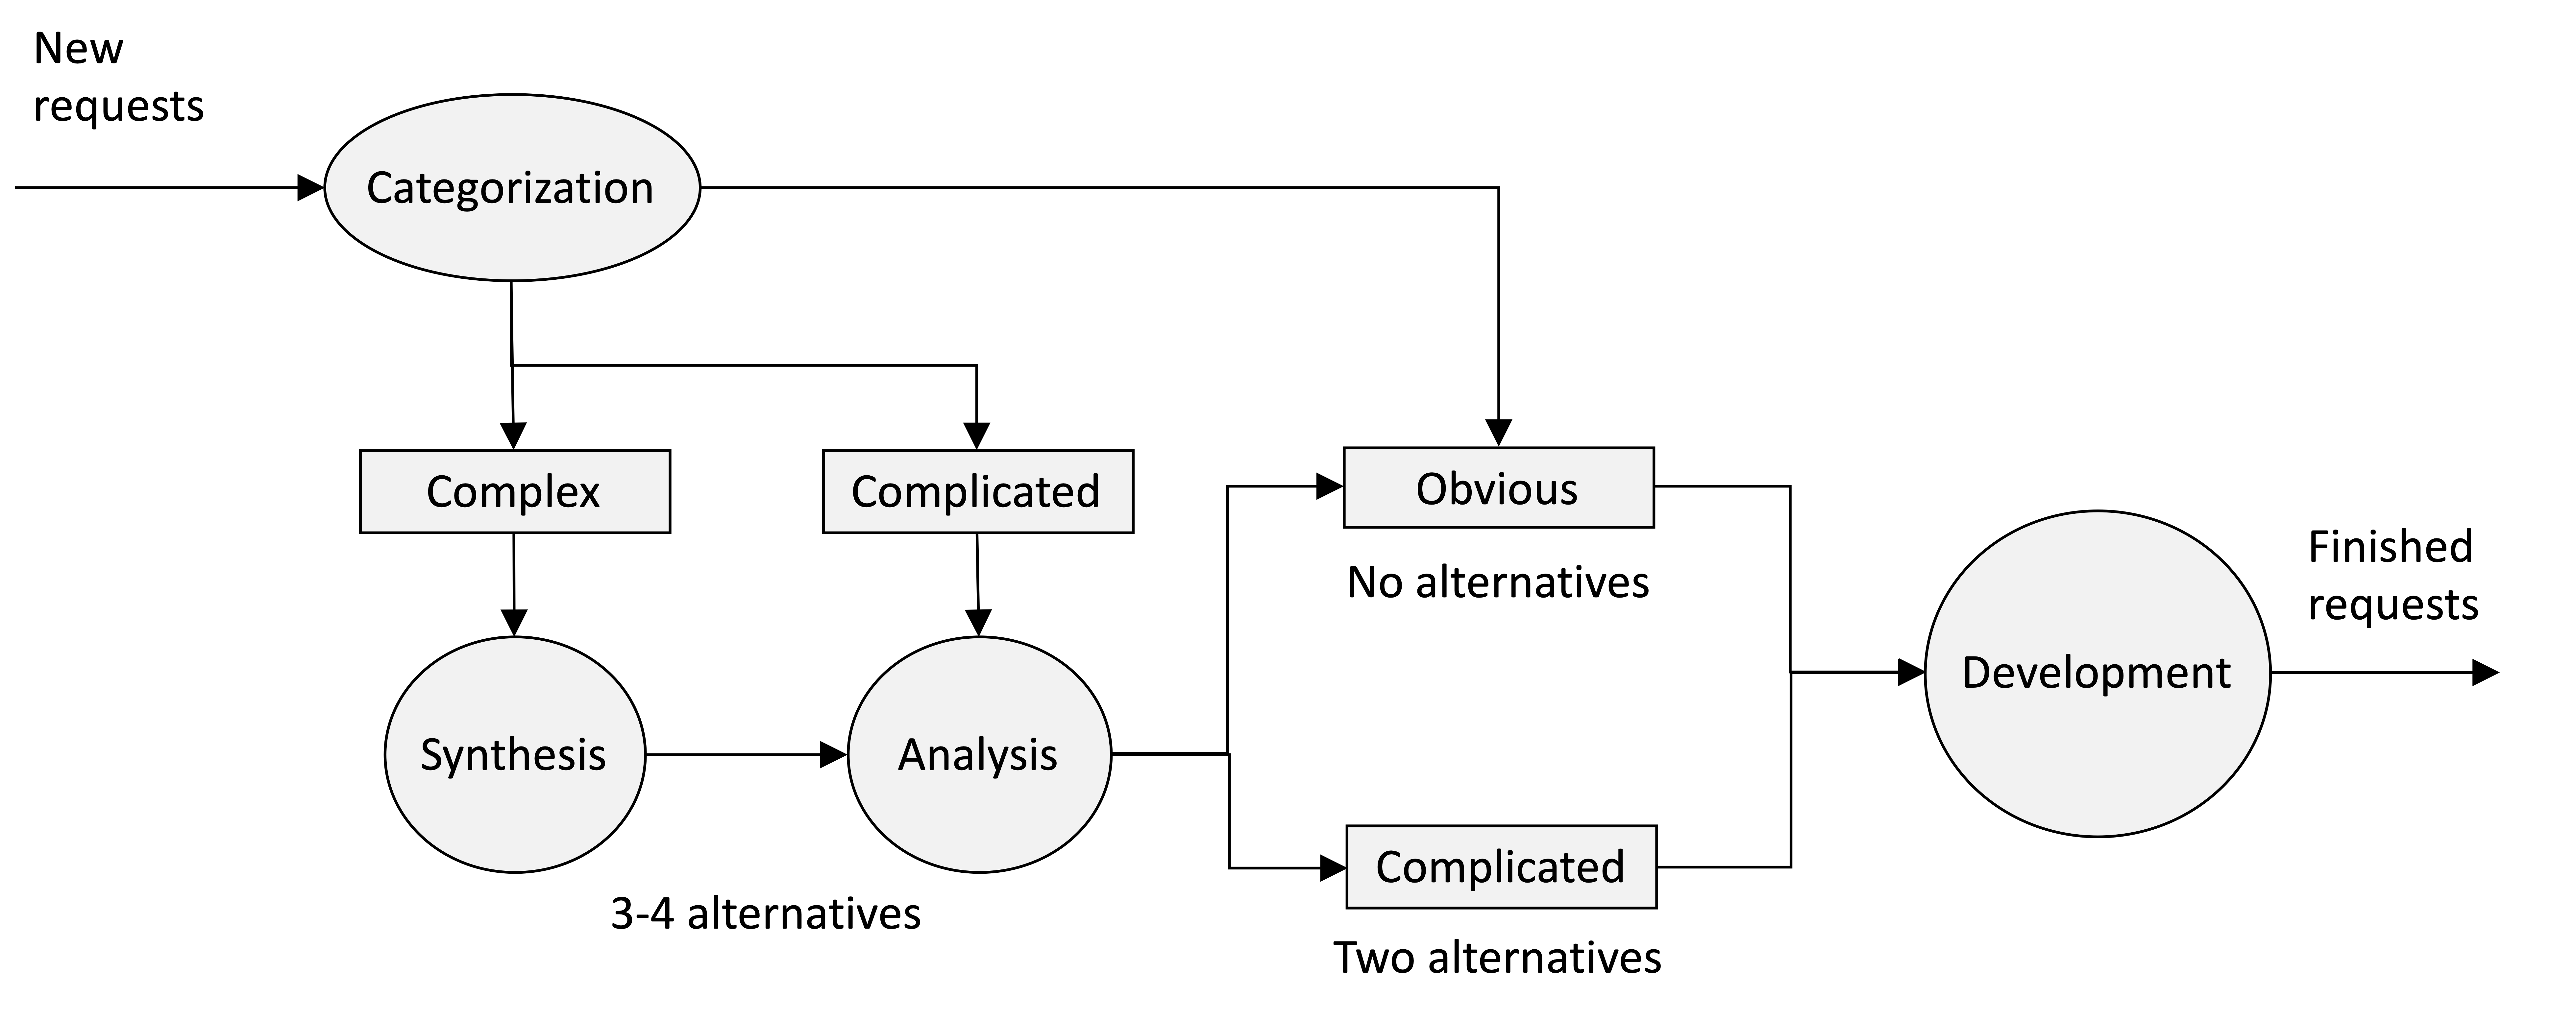
We see how complex options enter the funnel and get out as either complicated or clear following the bellow workflow. Each option needs to go through syntesis, analysis and development in order be delivered. We have the discovery process presented on Figure 17.
Figure 17: Discovery process
Here is how the process works. First step is to take one option and categorize it. Categorization means we place it at the proper cell in the complexity profile. As we saw earlier the complexity profile is like a funnel. Only complicated and clear options can leave the funnel.
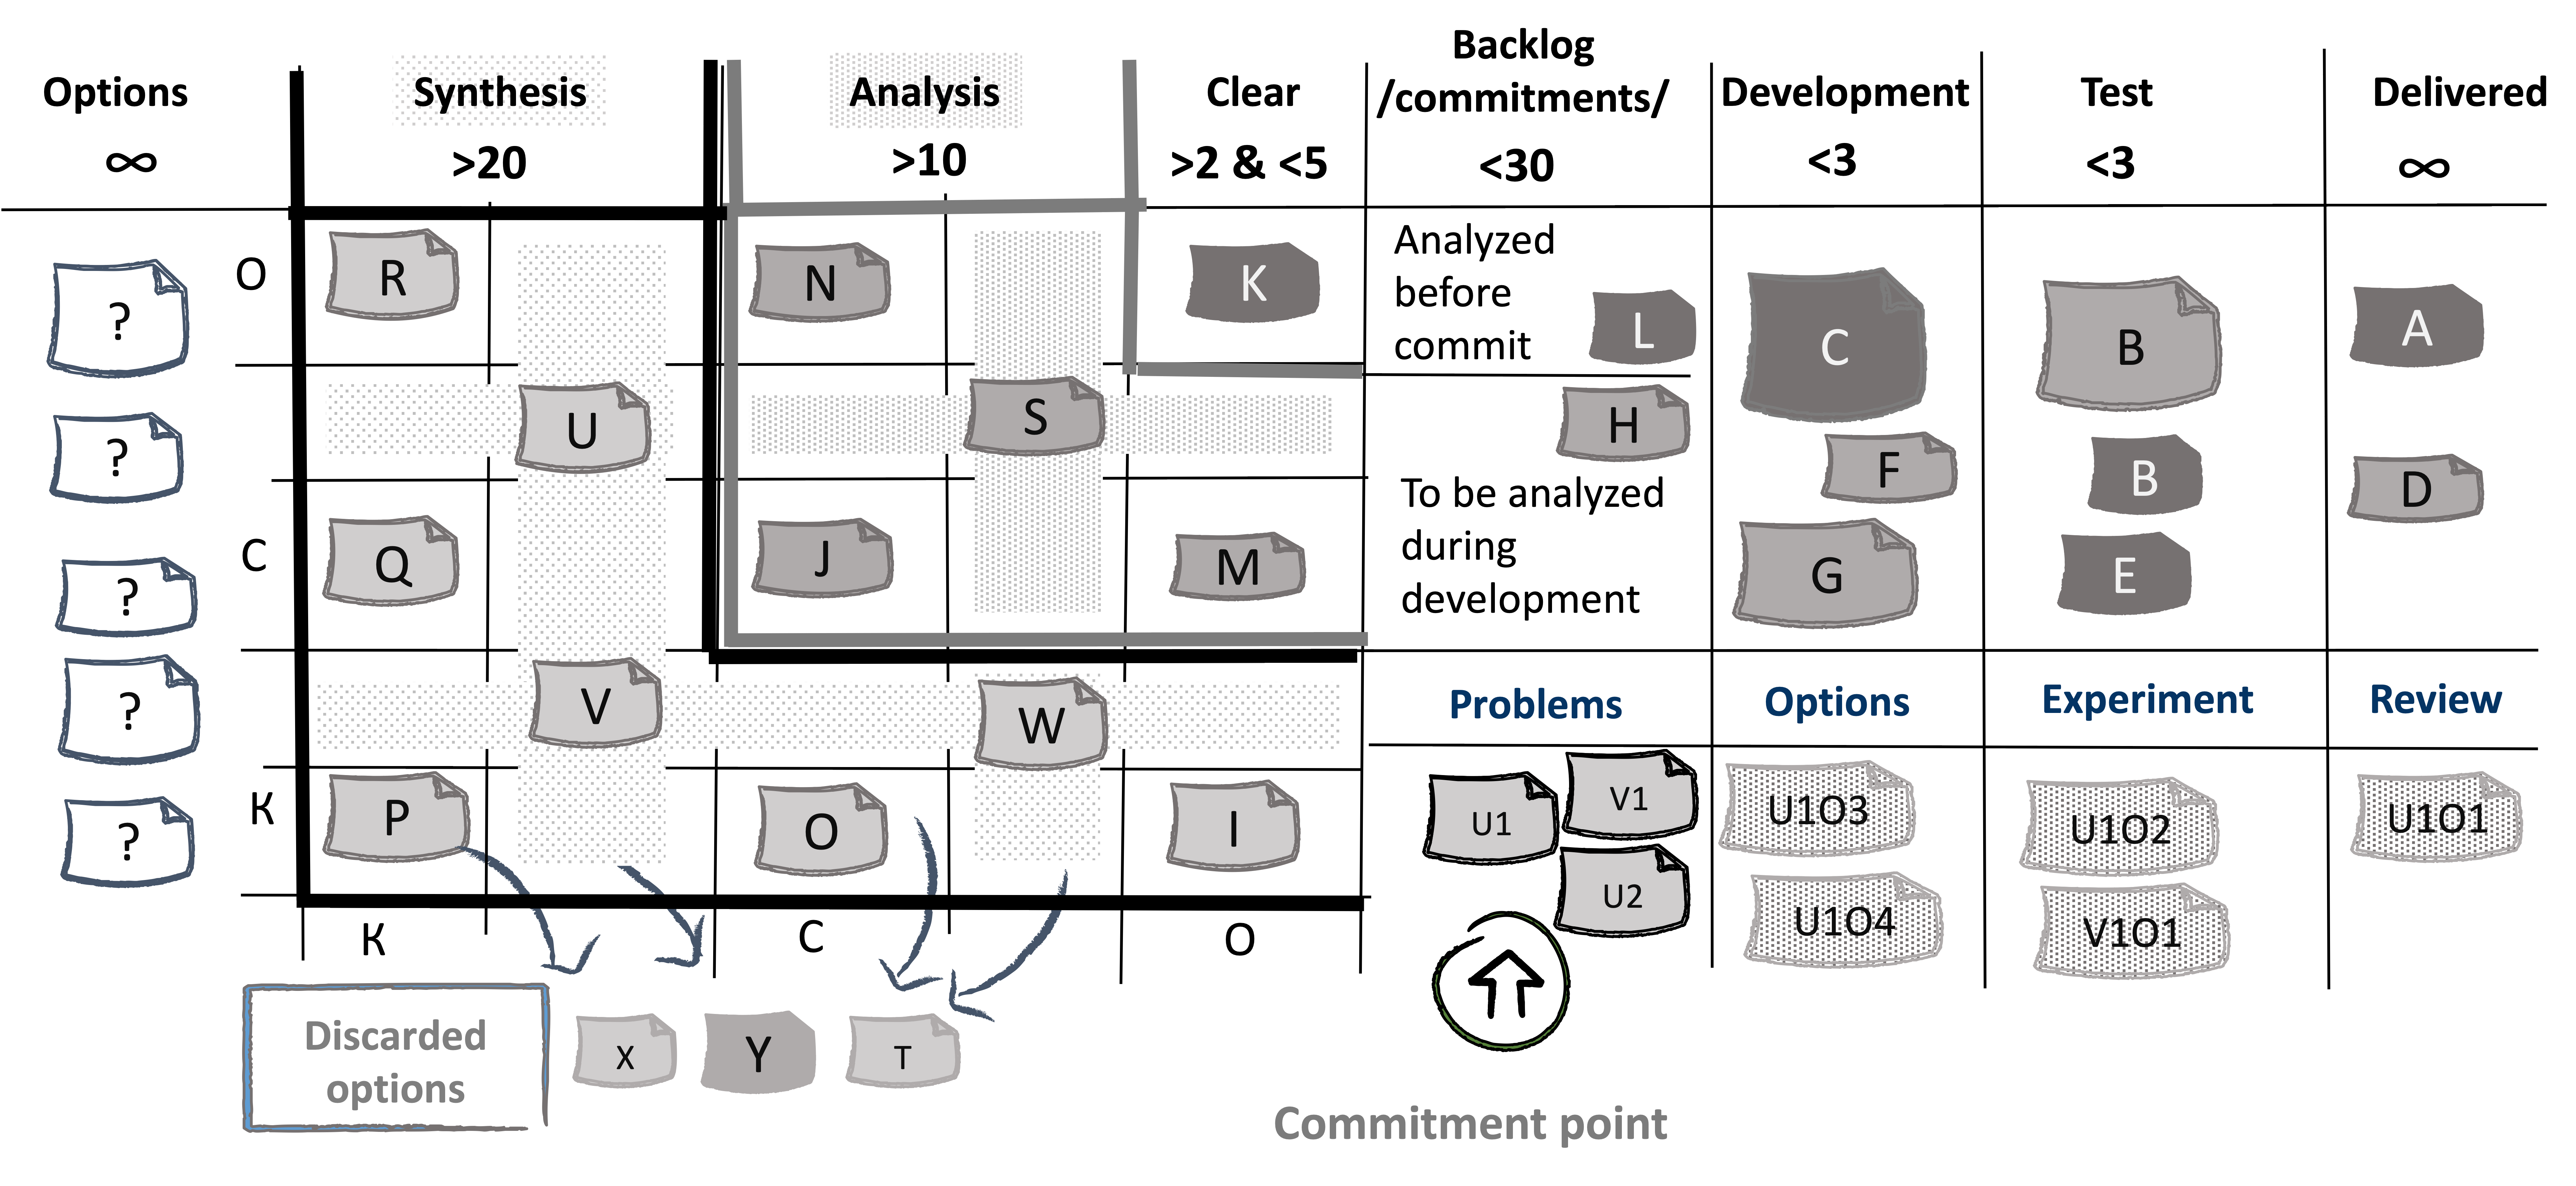
We can manage the movement of options on a End-to-end kanban board as presented on Figure 18.. On the righthand side we have the upstream kanban board. The options for new things to be developed enter here. We call them options on purpose in order to show that it is not mandatory for them to be delivered at all.
Figure 18: End-to-end kanban board
The lefthand Discovery part of the board tracks exploring options. The righthand Delivery part of the board tracks promisses to deliver. Options may be abandoned but promisses must be delivered.
On the board an option can leave the upstream part and enter the delivery part either from Analysis or from Clear. Cards in black are clear and can directly enter delivery.
Let’s not forget that in the delivery part we are dealing with requests. Requests should not be canceled because the delivery system has a limited and expensive capacity. In discovery part we are dealing with options. Options by definition can be abandoned. That is presented as the “Discarded options” area of the kanban board.
The cards in deep grey are complicated. It is not mandatory all complicated options to become clear. A complicated option may enter delivery when it is considered that the analysis can be done during the delivery. That could happen for two reasons. First is when an option is clear from client perspective and complicated from capability perspective because there are a couple of alternatives how to implement it. The choice of an alternative can be left to the delivery system to make. Second is when the option is complicated from client perspective because there are small details to be decided e.g. text message content, colors etc.. Those can be cleared during delivery.
An option cannot enter the delivery part from Synthesis! A complex option should never exit the funnel, because it will clutter the delivery process. The delivery system is not supposed to do the work of the discovery system, because the delivery system has no access to the client.
Both analysis and synthesis of an option may require some experiments or probes. A probe may be Proof of Concept (PoC), How we show on the board that we probe for an option? We put the option card in a transition cell between CxCx and CdCd on the complexity profile board. Then a new PoC card is placed in the Problems column. The PoC card follows the Options - Experiment - Review path. If the review provides enough information for the parent option card then it is moved into a CdCd cell on the complexity profile. If not then it stays in transition. It could be the case that it si decided to abandon the option.
It is also possible on the complexity profile cards to move “backwards” say from complicated to complex. For example, we have a complicated option with a couple of alternatives what to be done. The clients is considering which alternative to choose when a new information from the market arrives and suddenly none of the alternatives is viable anymore. The client is back to the spot where they don’t know whet they want. The option is again complex.
The discovery part of the board which visualizes the complexity profile is kanban system.
The WIP limits are set at the top of each column. The numbers show the minimum count of options that need to be present at any given time. For instance, the column Synthesis has to have at least 20 options. They could be a hundred but never less than twenty. We see that the minimum values get smaller as we move to Analysis and Clear. This is because we are operating a funnel. We need a lot of options to enter the funnel because a fraction of them will leave it as delivery requests. We see that the funnel starts at 20, then becomes 10 and end in 2-5 delivery requests. Why we want have 20 complex and only between 2 and 5 clear options? Because clear things are clear for everybody else and hence not valuable.
We have a pull system on the Discovery side. That means if we don’t have at least 20 complex options we have to do some work and find new ones. But the low limit on Clear will prevent us from picking easy-to-find but non-valuable clear options. We don’t want non-valuable, clear options to flood the delivery system with non-valuable delivery requests.
For our products we strive to have the proper combination of complex, complicated valuable and clear options.
Finally we establish a regular feedback loop to continuously revisit and update the categorization of the user stories in progress and categorize the newly added user stories.
STAFFING
We need different people to work on different entries in the complexity profile. The difference is the level of complexity they can handle both from Capability and Client perspectives.
For instance – if the problem is clear then we need a junior person, who can read a recipe book and follow it. He will need stable requirements and all the exact tools and technologies from the book.
If the problem is complex we need a senior person, who can cope without a recipe, with changing requirements and with whatever is available in terms of tools and technologies.
When we need to adapt we need more diversity in the system because then we’ve got more evolutionary capacity. It’s not a coincidence that for the living organisms the mutation rates increase under stress – more diversity more adaptability. The requisite diversity is the optimal level of diversity for the context we are in. Diversity means inefficiency an organization needs to have.
If over focused on efficiency the organization loses adaptive capacity.